1.basic
2.code
In [88]: from mpl_toolkits.mplot3d import Axes3D
In [89]: from matplotlib import cm
In [108]: from matplotlib.ticker import LinearLocator,FormatStrFormatter
In [91]: import matplotlib.pyplot as plt
In [92]: import numpy as np
In [93]: fig=plt.figure(figsize=(12,9))
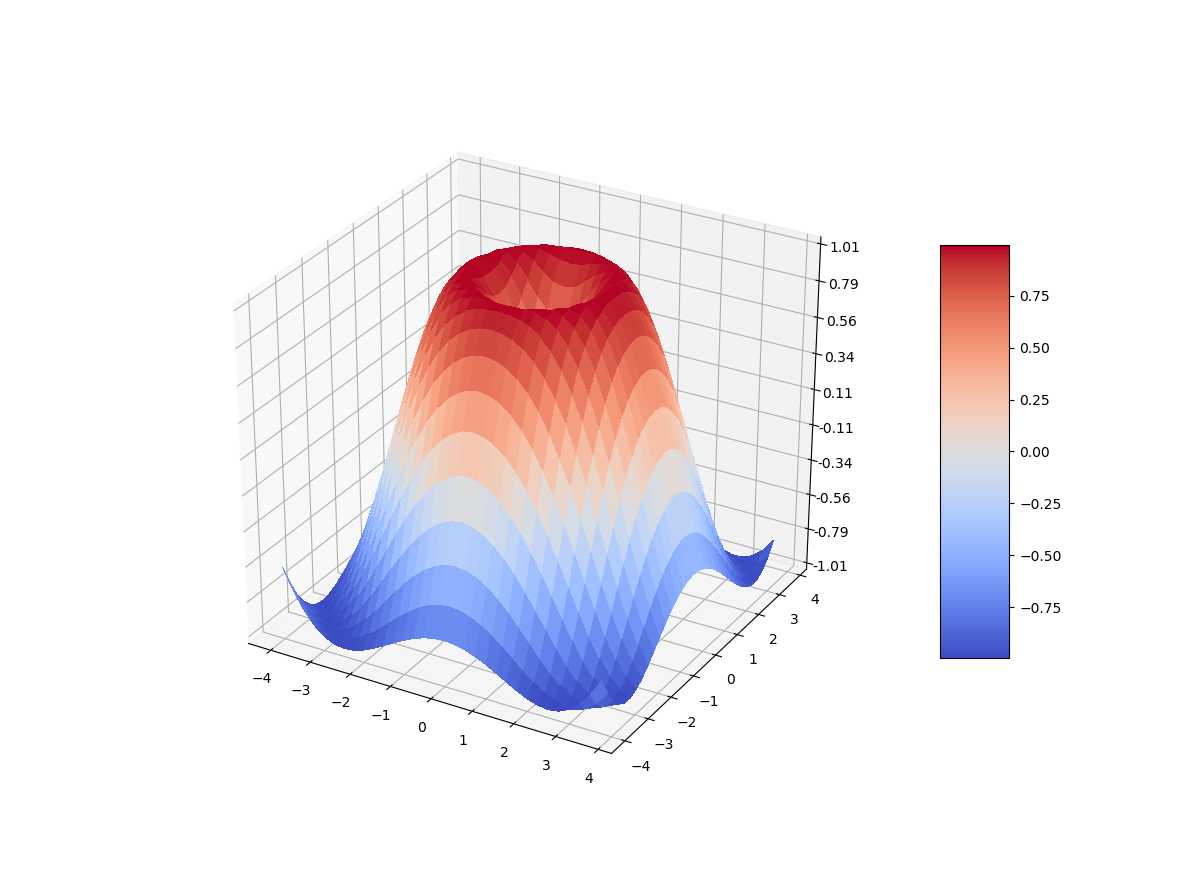
In [94]: points=np.arange(-4,4,0.25)
In [95]: xx,yy=np.meshgrid(points,points)
In [96]: r=np.sqrt(xx**2+yy**2)
In [97]: z=np.sin(r)
In [103]: surf=ax.plot_surface(xx,yy,z,rstride=1,cstride=1,cmap=cm.coolwarm,linewidth=0,antialiased=False)
In [104]: ax.set_zlim(-1.01,1.01)
Out[104]: (-1.01, 1.01)
In [105]: ax.zaxis.set_major_locator(LinearLocator(10))
In [109]: ax.zaxis.set_major_formatter(FormatStrFormatter('%.02f'))
In [110]: fig.colorbar(surf,shrink=0.6,aspect=6)
Out[110]: <matplotlib.colorbar.Colorbar at 0xaae3710>
In [111]: plt.show()
3.result