效果图:
dom:
<div class="chartAll" ref="chartAll"></div>
js:
let chartAll = this.$refs.chartAll//获取DOM
this.getChartAll = echarts.init(chartAll)
this.getChartAll.setOption(this.optionAll, true)
设置数据:
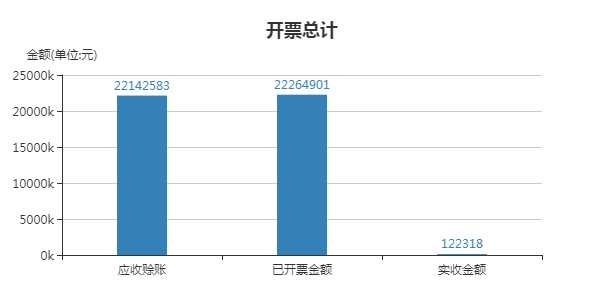
optionAll: {
          title: {
            text: ‘开票总计‘,
            left: ‘center‘
          },
          tooltip: {
            trigger: ‘axis‘,
            axisPointer: {
              type: ‘cross‘,
              crossStyle: {
                color: ‘#999‘
              }
            }
          },
          legend: {
            // bottom: 10,
            // data: [‘金额‘]
          },
          xAxis: [
            {
              type: ‘category‘,
              data: [‘应收赊账‘, ‘已开票金额‘, ‘实收金额‘],
              axisPointer: {
                type: ‘shadow‘
              }
            }
          ],
          yAxis: [
            {
              type: ‘value‘,
              name: ‘金额(单位:元)‘,
              // min: 0,
              // max: 500,
              // interval: 100,
              axisLabel: {
                formatter: function(value) {
                  let mun = value / 1000
                  return mun + ‘k‘
                }
              }
            }
          ],
          series: [
            {
              barMaxWidth: ‘50‘,
              itemStyle: {normal: {color: ‘#3580B8‘, label: {show: true, position: ‘top‘}}},
              name: ‘金额‘,
              type: ‘bar‘,
              data: []//显示的数据
            }
          ]
        }