标签:多边形 gen 用户 数学 namespace api line 渲染 方法
matplotlib.pyplot 是采用 python 语言和使用数值数学库 numpy 数组数据的绘图库.其主要目标是用于数据的可视化显示.
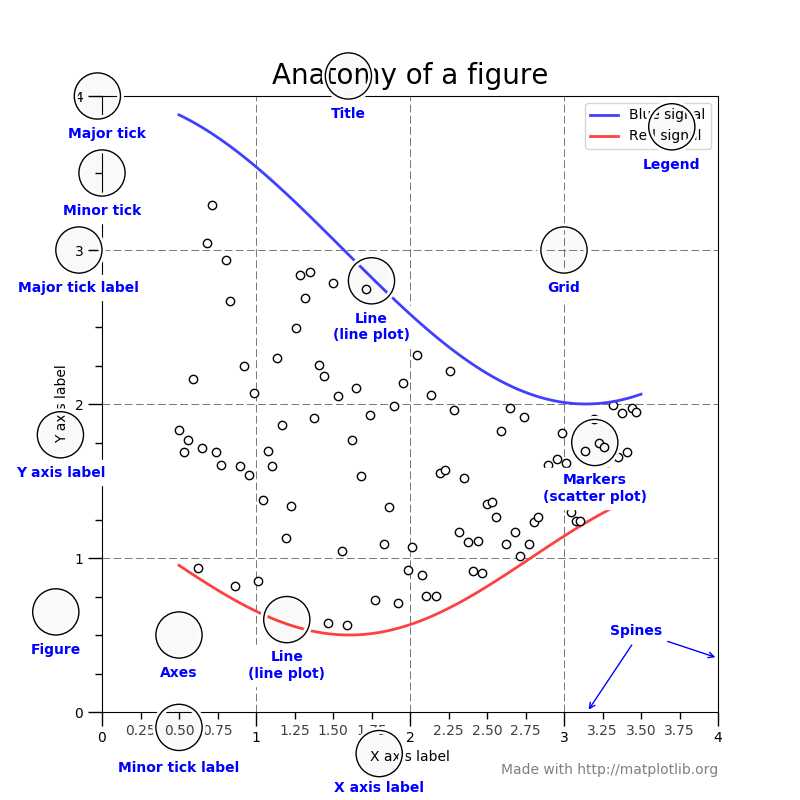
matplotlib.pyplot 模块中,其绘制的输出图形 (Figure) 的各组成部分,如下图所示
其中
Figure 是整个输出图形,记录了所有子 Axes 对象,一些特殊的 artists (如标题,图例等) 和画布 (canvas).画布 (canvas) 对用户是不可见的.
Axes 是含有数据空间的图像区域.一个 figure 可以包含多个 Axes,但一个给定的 Axes 只能在一个 Figure 中.注意 Axes 与 Axis 的区别,Axis是指数学上的坐标轴,Axes可以包含 2 个 (二维) 或 3 个坐标轴 (三维).在 matplotlib 模块中,matplotlib.axes.Axes类,包含大多数的图形元素,如坐标轴 (matplotlib.axis.Axis), 刻度 (matplotlib.axis.Tick), 二维线段 (matplotlib.lines.Line2D), 文本 (matplotlib.text.Text), 多边形 (matplotlib.patches.Polygon),并设置坐标系统;matplotlib.pyplot.axes(arg=None, **kwargs) 函数向当前的图形 (current figure) 中,增加一个 Axes 对象,并设置其为当前的 Axes 对象;matplotlib.pyplot.axis(*v, **kwargs) 函数用于获取或设置坐标轴属性.
在 Figure 上的任何对象,基本都是 Artist.当渲染图形时,所有的 Artists 都会画到画布 (canvas) 上.大多数 Artists 都绑定到一个 Axes 上,不能被多个 Axes 共享,或从一个 Axes 移动到另一个.
使用 matplotlib.pyplot 模块,通常有两种编码风格,一种是采用面向对象接口 (object-oriented interface) 的编码风格,另一种是类似 MATLAB (MATLAB-like) 的编码风格.对于复杂的图形绘制,推荐采用面向对象接口的编码风格.
import matplotlib.pyplot as plt
import numpy as np

x = np.arange(0, 10, 0.2)
y = np.sin(x)
fig = plt.figure()
ax = fig.add_subplot(111)
ax.plot(x, y)
plt.show()
上述代码中,使用 pyplot 创建和显示图形,剩下的使用对象方法实现,其中 ax 对象是 Axes 类的对象.对于 matplotlib.pyplot 模块,Axes 类和它的成员函数使用面向对象接口的主要入口点.
import matplotlib.pyplot as plt
import numpy as np

x = np.arange(0, 10, 0.2)
y = np.sin(x)
plt.figure()
plt.subplot(111)
plt.plot(x, y)
plt.show()
matplotlib.pyplot 是 matplotlib 模块中的一个模块;pylab 是安装 matplotlib 模块时附带安装的模块.
pylab 是一个带来便利的模块,其可以在单一的命名空间 (pylab namespace) 下导入用于绘图的 matplotlib.pyplot 模块和用于数值数学和操作数组的 numpy 模块.虽然有许多例子使用 pylab,但不再推荐使用.其示例代码,如下所示:
import pylab

x = pylab.arange(0, 10, 0.2)
y = pylab.sin(x)
fig = pylab.figure()
ax = fig.add_subplot(111)
ax.plot(x,y)
pylab.show()
1. Usage - The Matplotlib FAQ. https://matplotlib.org/faq/usage_faq.html.
2. matplotlib.pyplot - The Matplotlib API. https://matplotlib.org/api/_as_gen/matplotlib.pyplot.html.
3. pyplot summary - The Matplotlib API. https://matplotlib.org/api/pyplot_summary.html.
4. Axes class - The Matplotlib API. https://matplotlib.org/api/axes_api.html#matplotlib.axes.Axes
5. matplotlib.pyplot.axes - matplotlib.pyplot. https://matplotlib.org/api/_as_gen/matplotlib.pyplot.axes.html#matplotlib.pyplot.axes
6. matplotlib.pyplot.axis - matplotlib.pyplot. https://matplotlib.org/api/_as_gen/matplotlib.pyplot.axis.html#matplotlib.pyplot.axis
7. Pyplot tutorials - Tutorials. https://matplotlib.org/tutorials/introductory/pyplot.html.
标签:多边形 gen 用户 数学 namespace api line 渲染 方法
原文地址:https://www.cnblogs.com/klchang/p/8901758.html