标签:mat 技术分享 统计 start rom parse yellow ado port
import matplotlib.pyplot as plt
plt.rcParams[‘font.sans-serif‘]=[‘Simhei‘]
plt.rcParams[‘axes.unicode_minus‘]=False
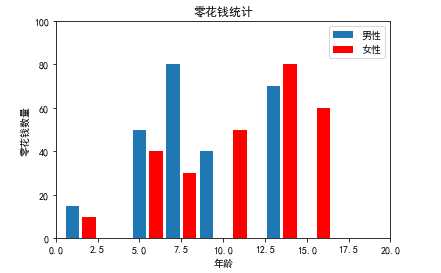
listx1 = [1,5,7,9,13,16]
listy1 = [15,50,80,40,70,50]
plt.bar(listx1, listy1, label="男性")
listx2 = [2,6,8,11,14,16]
listy2 = [10,40,30,50,80,60]
plt.bar(listx2, listy2, color="red", label="女性")
plt.legend()
plt.xlim(0, 20)
plt.ylim(0, 100)
plt.title("零花钱统计")
plt.xlabel("年龄")
plt.ylabel("零花钱数量")
plt.show()
import matplotlib.pyplot as plt
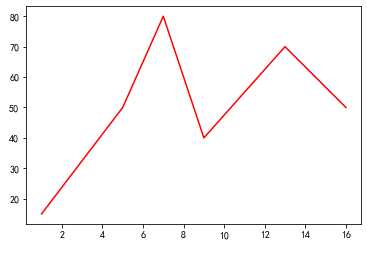
listx = [1,5,7,9,13,16]
listy = [15,50,80,40,70,50]
plt.plot(listx, listy, color ="red")
plt.show()
import matplotlib.pyplot as plt
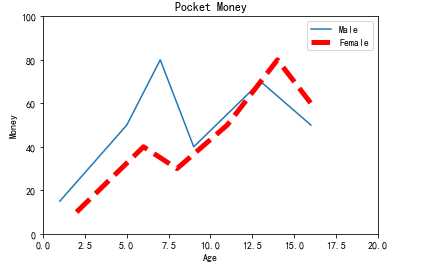
listx1 = [1,5,7,9,13,16]
listy1 = [15,50,80,40,70,50]
plt.plot(listx1, listy1, label="Male")
listx2 = [2,6,8,11,14,16]
listy2 = [10,40,30,50,80,60]
plt.plot(listx2, listy2, color="red", linewidth=5.0, linestyle="--", label="Female")
plt.legend()
plt.xlim(0, 20)
plt.ylim(0, 100)
plt.title("Pocket Money")
plt.xlabel("Age")
plt.ylabel("Money")
plt.show()
import matplotlib.pyplot as plt
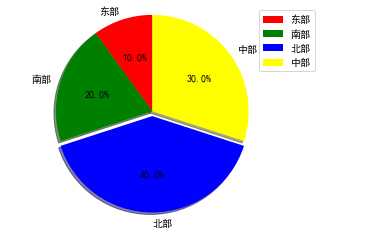
labels = ["东部", "南部", "北部", "中部"]
sizes = [5, 10, 20, 15]
colors = ["red", "green", "blue", "yellow"]
explode = (0, 0, 0.05, 0)
plt.pie(sizes,explode = explode,labels = labels,colors = colors,\
labeldistance = 1.1,autopct = "%3.1f%%",shadow = True,\
startangle = 90,pctdistance = 0.6)
plt.axis("equal")
plt.legend()
plt.show()
import numpy as np
import matplotlib.pyplot as plt #导入绘图模块,重命名为plt
import requests #导入网页内容抓取包
from bs4 import BeautifulSoup as bs #导入网页解析模块,重命名为bs
from pylab import * #导入pylab包
rcParams[‘font.sans-serif‘] = [‘SimHei‘] #让matplotlib支持简体中文
year = [] #横坐标列表
gdp = [] #纵坐标列表
#url = "http://value500.com/M2GDP.html" #设置要在哪个网页抓数据
url = "http://value500.com/M2GDP.html"
content = requests.get(url) #获取网页内容
print(content)
content.encoding=‘utf-8‘ #转为utf-8编码
content1=content.text #取得网页内容的text部分
parse = bs(content1,"html.parser") #进行html解析
data1 = parse.find_all("table") #获取所有表元素
rows = data1[19].find_all("tr") #取出包含所需数据的表(网页第20个表)
i=0 #为了不读取表头数据,设置此控制变量
for row in rows:
cols = row.find_all("td") #把每一行表数据存入cols变量
if(len(cols) > 0 and i==0): #如果是第一行,则控制变量加1
i+=1
else: #如果不是第一行,则写入绘图列表
year.append(cols[0].text[:-2]) #取得年份数据(数据的最后两个字符不是数据需去除)并写入图形的year轴
gdp.append(cols[2].text) #把gdp值存入gdp轴
plt.plot(year, gdp, linewidth=2.0) #绘制图形,线宽为2
plt.title("1990~2016年度我国GDP") #设置图形标题
plt.xlabel("年度") #设置x轴标题
plt.ylabel("GDP(亿元)") #设置y轴标题
plt.show() #显示所绘图形
from bokeh.plotting import figure, show
p = figure(width=800, height=400)
listx = [1,5,7,9,13,16]
listy = [15,50,80,40,70,50]
p.line(listx, listy)
show(p)
from bokeh.plotting import figure, show, output_file
output_file("F:\\pythonBase\\pythonex\\lineout.html")
p = figure(width=800, height=400)
listx = [1,5,7,9,13,16]
listy = [15,50,80,40,70,50]
p.line(listx, listy)
show(p)
from bokeh.plotting import figure, show
p = figure(width=800, height=400, title="零花钱统计")
# p.title_text_color = "green"
# p.title_text_font_size = "18pt"
p.xaxis.axis_label = "年龄"
p.xaxis.axis_label_text_color = "violet"
p.yaxis.axis_label = "零花钱"
p.yaxis.axis_label_text_color = "violet"
dashs = [12, 4]
listx1 = [1,5,7,9,13,16]
listy1 = [15,50,80,40,70,50]
p.line(listx1, listy1, line_width=4, line_color="red", line_alpha=0.3, line_dash=dashs, legend="男性")
listx2 = [2,6,8,11,14,16]
listy2 = [10,40,30,50,80,60]
p.line(listx2, listy2, line_width=4, legend="女性")
show(p)
from bokeh.plotting import figure, show
p = figure(width=800, height=400, title="零花钱统计")
# p.title_text_font_size = "18pt"
p.xaxis.axis_label = "X 轴"
p.yaxis.axis_label = "y 轴"
listx = [1,5,7,9,13,16]
listy = [15,50,80,40,70,50]
sizes=[10,20,30,30,20,10]
colors=["red","blue","green","pink","violet","gray"]
#sizes=25 #所有点相同大小
#colors="red" #所有点相同颜色
p.circle(listx, listy, size=sizes, color=colors, alpha=0.5)
show(p)
from bokeh.plotting import figure, show
import matplotlib.pyplot as plt #导入绘图模块,重命名为plt
import requests #导入网页内容抓取包
from bs4 import BeautifulSoup as bs #导入网页解析模块,重命名为bs
year = [] #横坐标列表
gdp = [] #纵坐标列表
url = "http://value500.com/M2GDP.html" #设置要在哪个网页抓数据
content = requests.get(url) #获取网页内容
content.encoding=‘utf-8‘ #转为utf-8编码
content1=content.text #取得网页内容的text部分
parse = bs(content1,"html.parser") #进行html解析
data1 = parse.find_all("table") #获取所有表元素
rows = data1[19].find_all("tr") #取出包含所需数据的表(网页第20个表)
i=0 #为了不读取表头数据,设置此控制变量
for row in rows:
cols = row.find_all("td") #把每一行表数据存入cols变量
if(len(cols) > 0 and i==0): #如果是第一行,则控制变量加1
i+=1
else: #如果不是第一行,则写入绘图列表
year.append(cols[0].text[:-2]) #取得年份数据(数据的最后两个字符不是数据需去除)并写入图形的year轴
gdp.append(cols[2].text) #把gdp值存入gdp轴
p = figure(width=800, height=400, title="1990~2016年度我国GDP") #在浏览器生成画图区域
p.title_text_font_size = "20pt" #设置字体大小为20
p.xaxis.axis_label = "年度" #设置x轴标题
p.yaxis.axis_label = "GDP(亿元)" #设置y轴标题
p.circle(year,gdp, size=6) # 圆点显示,点的大小为6
show(p) #显示图形
标签:mat 技术分享 统计 start rom parse yellow ado port
原文地址:https://www.cnblogs.com/tszr/p/10061290.html