标签:lan add func pop inf base com simple ima
<!DOCTYPE html>
<html lang="en">
<head>
<meta charset="UTF-8">
<meta name="viewport" content="initial-scale=1,maximum-scale=1,user-scalable=no">
<title>Intro to graphics - 4.10</title>
<link rel="stylesheet" href="https://js.arcgis.com/4.10/esri/css/main.css">
<style>
html,
body,
#viewDiv {
padding: 0;
margin: 0;
height: 100%;
width: 100%;
}
</style>
<script src="https://js.arcgis.com/4.10/"></script>
<script type="text/javascript">
require([
"esri/Map",
"esri/views/MapView",
"esri/Graphic"
],function(
Map,
MapView,
Graphic
)
{
var map = new Map({
basemap: "hybrid"
});
var view = new MapView({
container: "viewDiv",
map: map,
center: [-80, 35],
zoom: 3
});
//==========================Create a point graphic
//1. create a point geometry
var point = {
type:"point",
longitude:-49.97,
latitude:41.73
}
//2. Create a symbol for drawing this point
var marker_point = {
type:"simple-marker",
color:[226, 119, 40],
outline:{
color:[255,255,255],
width:2
}
}
//3. Create a graphic and add the geometry and symbol to it
var pointGraphic = new Graphic({
geometry:point,
symbol:marker_point
});
//==========================Create a polyline graphic
var line = {
type:"polyline",
paths:[
[-111.30, 52.68],
[-98, 49.5],
[-93.94, 29.89]
]
}
var marker_line = {
type:"simple-line",
color:[226, 119, 40],
width:4
}
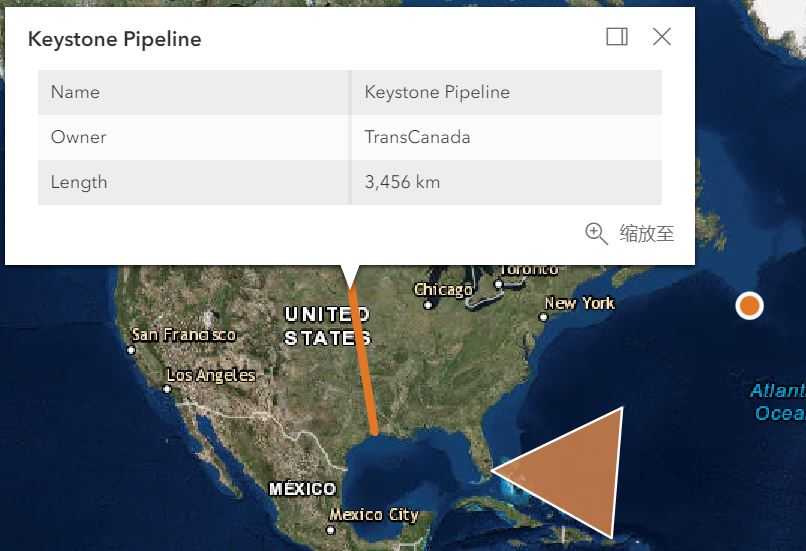
var lineAtt = { //json-type data-used for popups
Name:"Keystone Pipeline",
Owner:"TransCanada",
Length:"3,456 km"
}
var lineGraphic = new Graphic({
geometry:line,
symbol:marker_line,
attributes:lineAtt,
popupTemplate:{
title:"{Name}", //define title
content:[{ //define content
type:"fields", //table type is fields
fieldInfos:[{
fieldName:"Name"
},
{
fieldName:"Owner"
},
{
fieldName:"Length"
}
]
}]
}
})
//==========================Create a polygon graphic
var polygon = {
type:"polygon",
rings:[
[-64.78, 32.3],
[-66.07, 18.45],
[-80.21, 25.78],
[-64.78, 32.3]
]
}
var marker_polygon = {
type:"simple-fill",
color:[227, 139, 79, 0.8],
outline:{
color:[255,255,255],
width:1
}
}
var polygonGraphic = new Graphic({
geometry:polygon,
symbol:marker_polygon
});
view.graphics.addMany([pointGraphic,lineGraphic,polygonGraphic]);
})
</script>
</head>
<body>
<div id="viewDiv"></div>
</body>
</html>
Intro to graphics
标签:lan add func pop inf base com simple ima
原文地址:https://www.cnblogs.com/GIS-Yangol/p/10194849.html