标签:class demo one 3.2 his render tool border log
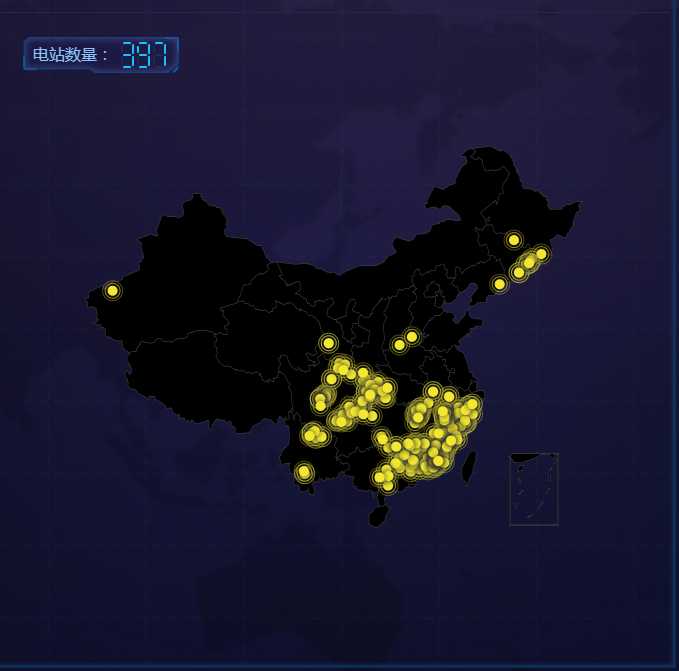
一、运行截图
二、代码
html代码:
 1 <div style="padding:24px;">
 2
 3   <p style="font-size: 16px;margin-bottom: 0px;color: #8cc5fe;background-image: url(‘./../../assets/images/maptitle.png‘);width: 250px;background-size: contain;background-repeat: no-repeat;height: 36px;line-height: 32px;padding-left: 10px;position: absolute;z-index: 0;">
 4     电站数量:
 5     <label *ngIf="mapComponentConfig.length !=0" style="font-size: 22px;font-family: -webkit-pictograph;color: #1bc3fd;">
 6       <app-led-clockfont [fontValue]="mapComponentConfig.length"></app-led-clockfont>
 7       <!-- mapComponentConfig.length = 397 -->
 8     </label>
 9     <label *ngIf="mapComponentConfig.length ==0" style="font-size: 22px;font-family: -webkit-pictograph;color: #1bc3fd;"><b>--</b></label>
10   </p>
11   <div echarts [options]="option1"  (chartInit)="onChartInit($event)" class="demo-chart" style="min-height: 600px;"></div>
12 </div>
ts代码:
  1 import { Component, OnInit, Input, SimpleChanges } from ‘@angular/core‘;
  2 import { HttpClient } from ‘@angular/common/http‘;
  3 import * as echarts from ‘echarts‘;
  4
  5 @Component({
  6   selector: ‘app-map‘,
  7   templateUrl: ‘./map.component.html‘,
  8   styleUrls: [‘./map.component.css‘]
  9 })
 10 export class MapComponent implements OnInit {
 11   @Input() mapComponentConfig;
 12   private map:any ;
 13   public option1:any;
 14   //地图
 15   private data = [];
 16   private provinceDataStatus:any;
 17   private echartsIntance:any;
 18    29   constructor(private http:HttpClient) {
 30     console.log("我在‘地图‘组件,构造函数中");
 31    }
 32
 33
 34   ngOnInit() {
 35     console.log("我在‘地图‘组件,初始化函数中");
 36     this.http.get(‘assets/data/china.json‘)
 37         .subscribe(geoJson  => {
 38             echarts.registerMap(‘china‘, geoJson);
 39             if(this.mapComponentConfig){
 40                 this.option1 = {
 41                     backgroundColor: ‘transparent‘,
 42                     title: {
 43                       text: ‘‘,
 44                     //   this.mapComponentConfig.count
 45                       left: ‘left‘,
 46                       textStyle: {
 47                           color: ‘#fff‘
 48                       }
 49                     },
 50                     tooltip : {
 51                       trigger: ‘item‘
 52                     },
 53                     legend: {
 54                       orient: ‘vertical‘,
 55                       y: ‘bottom‘,
 56                       x:‘right‘,
 57                       data:[‘pm2.5‘],
 58                       textStyle: {
 59                           color: ‘#fff‘
 60                       }
 61                     },
 62                     formatter: ‘{b}‘,
 63                     geo: {
 64                       map: ‘china‘,
 65                         // map: ‘China‘,
 66                       label: {
 67                           emphasis: {
 68                               show: false
 69                           }
 70                       },
 71                       roam: true,
 72                       itemStyle: {
 73                         //   color:‘purple‘,
 74                           borderColor :‘black‘,
 75                           borderWidth :5,
 76                           normal: {
 77                               areaColor: ‘black‘,
 78                             //   borderColor: ‘purple‘
 79                           },
 80                           emphasis: {
 81                             areaColor: ‘black‘,
 82                             //   areaColor: ‘#2a333d‘
 83                           }
 84                       }
 85                     },
 86                     series : [
 87                       {
 88                           name: ‘‘,
 89                           type: ‘effectScatter‘,
 90                           coordinateSystem: ‘geo‘,
 91                           data:this.convertData(this.mapComponentConfig.data),
 92                           zoom: 3.2,
 93                           symbolSize:10,
 94                           showEffectOn: ‘render‘,
 95                           rippleEffect: {
 96                               brushType: ‘stroke‘
 97                           },
 98                           hoverAnimation: true,
 99                           label: {
100                               normal: {
101                                   formatter: ‘{b}‘,
102                                   position: ‘right‘,
103                                   show: false
104                               }
105                           },
106                           itemStyle: {
107                               normal: {
108                                   color: ‘#f4e925‘,
109                                   shadowBlur: 10,
110                                   shadowColor: ‘#333‘
111                               }
112                           },
113                           zlevel: 1
114                       }
115                     ]
116                 };
117
118             }else{
119                 console.log("地图数据请求超时");
120             };
121         })
122   }
123
124   convertData (data) {
125     const _self = this;
126     let res = [];
127     if(_self.mapComponentConfig){
128         for (var i = 0; i < _self.mapComponentConfig.length; i++) {
129             res.push({
130                 name:_self.mapComponentConfig[i].station_name,
131                 value:[_self.mapComponentConfig[i].jingdu,_self.mapComponentConfig[i].weidu]
132             })
133         }
134         return res;
135     }else{
136         //Do-nothing
137          res = [];
138          return res;
139     }
140   };
141
142   //图表初始化实例
143   onChartInit(event) {
144     145     this.echartsIntance = event;
146     // this.echartsIntance.showLoading(this.default);
147   }
148
149   ngOnChanges(changes: SimpleChanges): void {
150
151      if(changes[‘mapComponentConfig‘] !== undefined){
152          let new_data = this.mapComponentConfig.data;
153             this.option1 = {
154                 backgroundColor: ‘transparent‘,
155                 title: {
156                   text: ‘‘,
157                   left: ‘left‘,
158                   textStyle: {
159                       color: ‘#fff‘
160                   }
161                 },
162                 tooltip : {
163                   trigger: ‘item‘
164                 },
165                 legend: {
166                   orient: ‘vertical‘,
167                   y: ‘bottom‘,
168                   x:‘right‘,
169                   data:[‘pm2.5‘],
170                   textStyle: {
171                       color: ‘#fff‘
172                   }
173                 },
174                 formatter: ‘{b}‘,
175
176                 geo: {
177                   map: ‘china‘,
178                   label: {
179                       emphasis: {
180                           show: false
181                       }
182                   },
183                   roam: true,
184                   itemStyle: {
185                       borderColor :‘black‘,
186                       borderWidth :5,
187                       normal: {
188                           areaColor:‘black‘,
189                       },
190                       emphasis: {
191                         areaColor: ‘black‘,
192                       }
193                   }
194                 },
195                 series : [
196                   {
197                       name: ‘‘,
198                       type: ‘effectScatter‘,
199                       coordinateSystem: ‘geo‘,
200                       data:this.convertData(new_data),
201                       zoom: 3.2,
202                       symbolSize:10,
203                       showEffectOn: ‘render‘,
204                       rippleEffect: {
205                           brushType: ‘stroke‘
206                       },
207                       hoverAnimation: true,
208                       label: {
209                           normal: {
210                               formatter: ‘{b}‘,
211                               position: ‘right‘,
212                               show: false
213                           }
214                       },
215
216                       itemStyle: {
217                           normal: {
218                               color: ‘#f4e925‘,
219                             //   color:‘#e96c1d‘,
220                               shadowBlur: 10,
221                               shadowColor: ‘#333‘
222                           }
223                       },
224                       zlevel: 1
225                   }
226                 ]
227             };
228
229             // if(this.echartsIntance){
230             //     console.log("this.echartsIntance:",this.echartsIntance);
231             //     this.echartsIntance.hideLoading();
232             // }else{
233             //     //Do-nothing
234             // }
235
236      }else{
237          console.log("地图数据加载超时");
238      }
239
240   }
241
242
243
244 }
标签:class demo one 3.2 his render tool border log
原文地址:https://www.cnblogs.com/mycnblogs-guoguo/p/10382903.html