标签:rap port bsp seconds alt 能源 例子 一个 lam
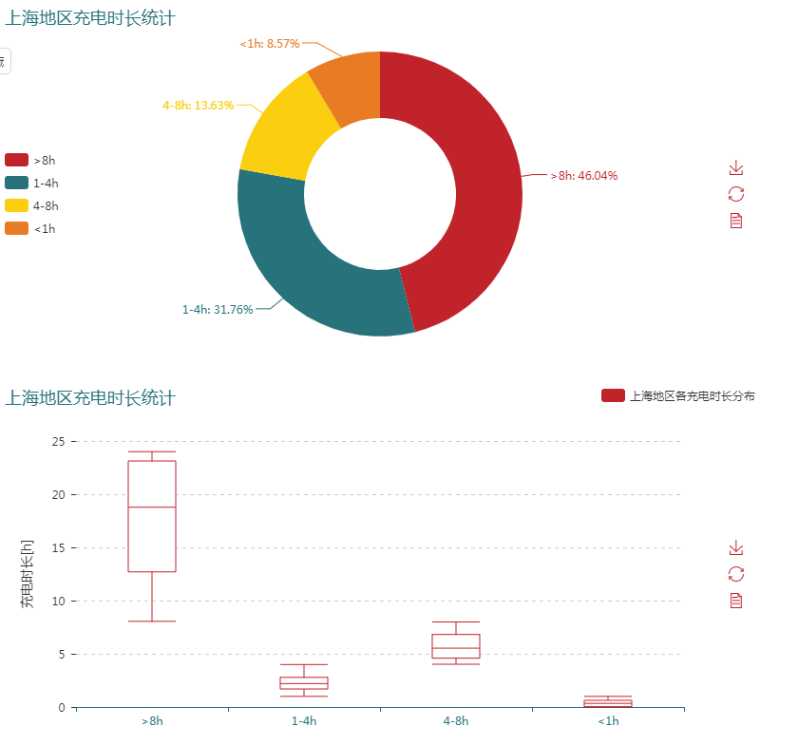
工作中遇到的一个问题: 统计各地区新能源汽车的充电时长 数据来源是北理新源的单日全球的运行数据。
这里仅统计北上广重庆四个地区的 数据处理的代码就省略了 需要整理好的是4个dataframe(数据已保存为H5格式) 分别是对应上述4个城市的:
import pandas as pd
from pyecharts import Boxplot,Pie,Page
theme_echart=‘infographic‘

location_list=[‘shanghai‘,‘chongqing‘,‘guangdong‘,‘beijing‘]
ans_vid={}

for i in location_list:
    ans_vid[i]=pd.read_hdf(i+‘_charging.h5‘,encoding=‘gbk‘)

location_list_chinese=[‘上海‘,‘重庆‘,‘广东‘,‘北京‘];
for i in range(len(location_list_chinese)):
    ans_vid[location_list_chinese[i]] = ans_vid.pop(location_list[i])
例:
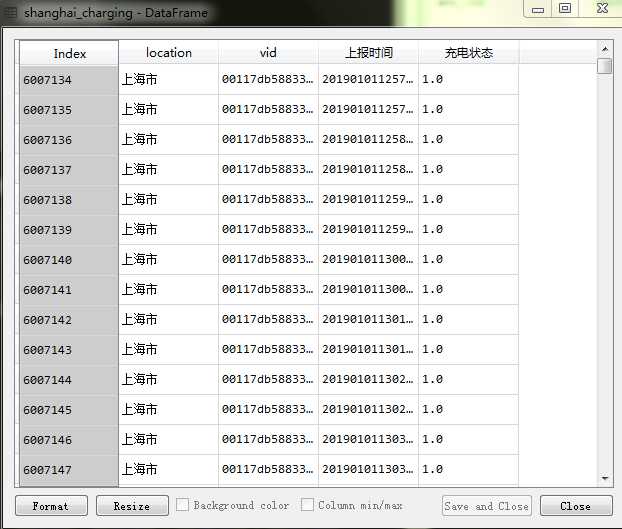
这时候我们需要提取其中的时间序列统计所有vid的 充电状态为1的第一个时间和最后一个时间 即为该车的充电时长
代码如下:
page=Page()
for i in location_list_chinese:
    ans_vid[i]=ans_vid[i][ans_vid[i][‘充电状态‘]==‘1.0‘]
    temp1=ans_vid[i].drop_duplicates([‘vid‘],keep=‘last‘)
    temp2=ans_vid[i].drop_duplicates([‘vid‘],keep=‘first‘)
    a=temp2[‘上报时间‘]
    b=temp1[‘上报时间‘]
    a=a.reset_index()
    b=b.reset_index()
    a=a.drop([‘index‘],axis=1)
    b=b.drop(‘index‘,axis=1)
    a[‘上报时间‘]=a[‘上报时间‘].astype(str)
    a[‘上报时间‘]=a[‘上报时间‘].apply(lambda v: v[0:4]+‘-‘+v[4:6]+‘-‘+v[6:8]+‘ ‘+v[8:10]+‘:‘+v[10:12]+‘:‘+v[12:14])
    b[‘上报时间‘]=b[‘上报时间‘].astype(str)
    b[‘上报时间‘]=b[‘上报时间‘].apply(lambda v: v[0:4]+‘-‘+v[4:6]+‘-‘+v[6:8]+‘ ‘+v[8:10]+‘:‘+v[10:12]+‘:‘+v[12:14])
    b[‘上报时间‘]=pd.to_datetime(b[‘上报时间‘])
    a[‘上报时间‘]=pd.to_datetime(a[‘上报时间‘])
    temp=b[‘上报时间‘]-a[‘上报时间‘]
    temp=pd.DataFrame(temp)
    temp[‘上报时间‘]=temp[‘上报时间‘].dt.total_seconds()/3600
    temp[‘充电时长‘]=temp[‘上报时间‘].astype(str)
    temp[‘充电时长‘][temp[‘上报时间‘]<=1]=‘<1h‘
    temp[‘充电时长‘][(temp[‘上报时间‘]>1) & (temp[‘上报时间‘]<=4)]=‘1-4h‘
    temp[‘充电时长‘][(temp[‘上报时间‘]>4) & (temp[‘上报时间‘]<=8)]=‘4-8h‘
    temp[‘充电时长‘][temp[‘上报时间‘]>8]=‘>8h‘
    local_charging_time=temp[‘充电时长‘].value_counts()
    box=Boxplot(i+‘地区充电时长统计‘)
    pie=Pie(i+‘地区充电时长统计‘)
    box.use_theme(theme_echart)
    pie.use_theme(theme_echart)
#    kwargs = dict(name = i,
#    x_axis = list(local_charging_time.index),
#    y_axis = list(local_charging_time.values),
#    is_legend_show=False,
#    is_label_show=True
#    )
#    bar.add(**kwargs)
    x=list(local_charging_time.index);
    y=list(local_charging_time.values);
    pie.add("",x,y,radius=(40,75),
               is_label_show=True,legend_orient = ‘vertical‘,
               legend_pos = ‘left‘,legend_top=‘center‘)
    # box画图
    y_axis =[]
    for j in x:
        y_axis.append(list(temp[‘上报时间‘][temp[‘充电时长‘]==j]))
    y=box.prepare_data(y_axis)
    box.add(i+‘地区各充电时长分布‘, x, y,xaxis_name=‘‘,
      yaxis_name=‘充电时长[h]‘,is_legend_show=True,legend_pos=‘right‘,is_label_show=True,yaxis_name_gap=45,xaxis_type=‘category‘,xaxis_rotate=0)
    page.add(pie)
    page.add(box)
    del box,pie

page.render(‘北上广重地区充电时长统计_v2.html‘)
可以看到核心处理程序是pd.to_datetime(a[‘上报时间‘])
temp[‘上报时间‘]=temp[‘上报时间‘].dt.total_seconds()/3600 # 此处提取时间差格式的秒数, 再折算成小时
结果如下图:
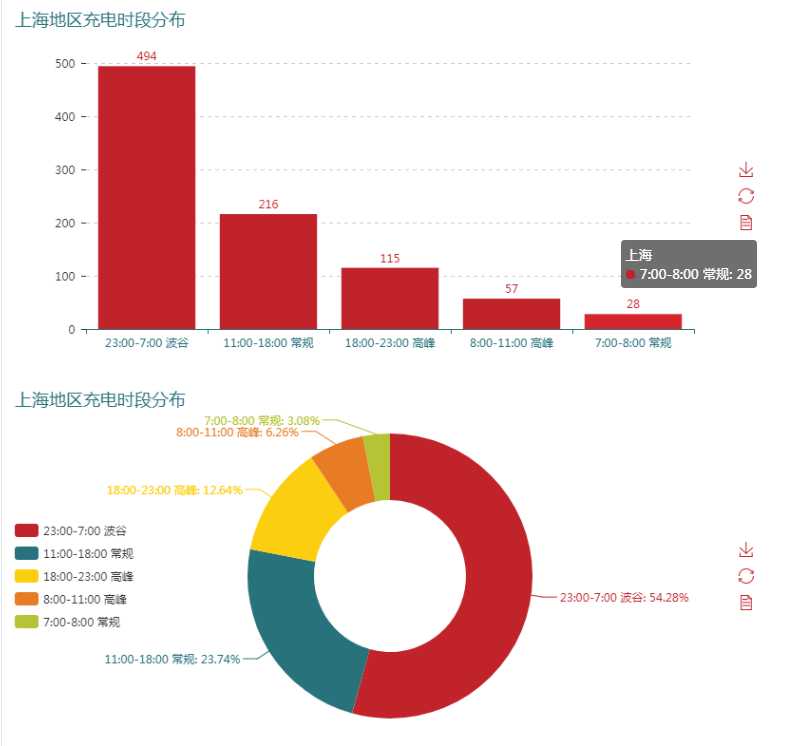
一个相似的例子是需要统计这四个地区的充电开始时段的分布(根据电网电价的需求而来)
核心是将连续的时间格式字符Series集成转化成时间格式,即‘20190101235502‘转化成 2019-01-01 23:55:02
然后调用pd.to_datetime
标签:rap port bsp seconds alt 能源 例子 一个 lam
原文地址:https://www.cnblogs.com/techs-wenzhe/p/10931282.html