标签:nsa style top can ict drag 桥接 slice self
关于charts的系列视图介绍传送门:
iOS 图表工具charts介绍
iOS 图表工具charts之LineChartView
iOS 图表工具charts之BarChartView
iOS 图表工具charts之PieChartView
iOS 图表工具charts之CandleStickChartView
iOS 图表工具charts之CombinedChartView
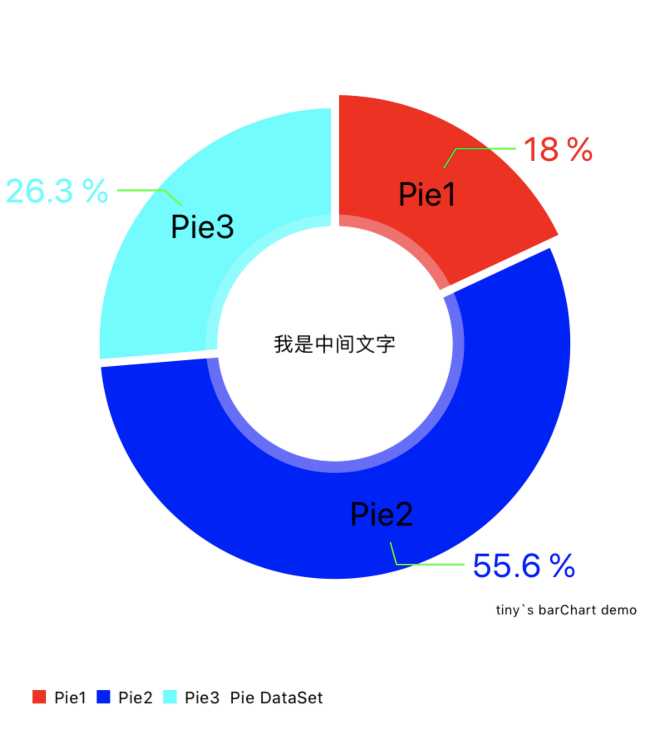
PieChartView在charts中可以用来绘制饼状图,由于charts是基于swift开发的,如果需要和objective-C混编(通过pod的方式不用管),可以参考我的上几篇文章iOS OC中桥接swift第三方库》,这里主要讲的是PieChartView的一些常用属性和一些基本用法,实际情况以开发为准
PieChartView的一下属性介绍
    PieChartView *chartView = [[PieChartView alloc] init];
    //设置偏移
    [chartView setExtraOffsetsWithLeft:20 top:20 right:20 bottom:20];

    //无内容显示
    chartView.noDataText = @"";
    //关闭描述
    chartView.chartDescription.enabled = YES;
    chartView.chartDescription.text = @"tiny`s barChart demo";
    //关闭图例
    chartView.legend.enabled = YES;
    //将数据转换为百分比
    chartView.usePercentValuesEnabled = YES;
    //惯性
    chartView.dragDecelerationFrictionCoef = 0.5;  //0 1 惯性
    //设置中间文字
    chartView.drawCenterTextEnabled = YES;
    chartView.centerText = @"我是中间文字";
    //显示扇形区域文字
    chartView.drawEntryLabelsEnabled = YES;
    //可以旋转
    chartView.rotationEnabled = YES;
    //扇区可点击
    chartView.highlightPerTapEnabled = YES;
    //代理
    chartView.delegate = self;
PieChartDataEntry 每个扇形区域
    NSArray *datas = @[@"24",@"74",@"35"];
    NSArray *titles = @[@"Pie1",@"Pie2",@"Pie3"];
    NSMutableArray *array = [NSMutableArray array];
    for (int i = 0; i < datas.count; i++) {
        PieChartDataEntry *entry = [[PieChartDataEntry alloc] initWithValue:[datas[i] integerValue] label:titles[i]];
        [array addObject:entry];
    }
PieChartDataSet 多个PieChartDataEntry扇形区域组合在一起就成了一个饼状图
    PieChartDataSet *set = [[PieChartDataSet alloc] initWithEntries:array label:@"Pie DataSet"];

    //颜色(每个扇形区域可以单独设置颜色)
    set.colors = @[UIColor.redColor,UIColor.blueColor,UIColor.cyanColor];
    set.entryLabelFont = [UIFont systemFontOfSize:20];
    set.entryLabelColor = [UIColor blackColor];
    set.drawIconsEnabled = NO;
    //    当饼状图带折线时,dataSet.yValuePosition 数值的位置只有设置为
    //    PieChartValuePositionOutsideSlice,折线才会显示,valueLine相关属性才有用
    set.drawValuesEnabled = YES;
    set.valueFont = [UIFont systemFontOfSize:20];
    set.valueColors = @[UIColor.redColor,UIColor.blueColor,UIColor.cyanColor];
    set.yValuePosition = PieChartValuePositionOutsideSlice;
    set.valueLineColor = UIColor.greenColor;
    //格式化
    NSNumberFormatter *pFormatter = [[NSNumberFormatter alloc] init];
    pFormatter.numberStyle = NSNumberFormatterPercentStyle;
    pFormatter.maximumFractionDigits = 1;
    pFormatter.multiplier = @1.f;
    pFormatter.percentSymbol = @" %";
    set.valueFormatter = [[ChartDefaultValueFormatter alloc] initWithFormatter:pFormatter];

    //相邻区块之间的间距
    set.sliceSpace = 5;
    //扇形区域放大范围
    set.selectionShift = 8;
    //动画开始的角度

    PieChartData *data = [[PieChartData alloc] initWithDataSet:set];

    self.chartView.data = data;
    //动画开启
    [self.chartView animateWithXAxisDuration:2.0f easingOption:ChartEasingOptionEaseOutExpo];
一些需要注意的点:
1.点击扇形区域可以缩放
1.设置PieChartView可点击chartView.highlightPerTapEnabled = YES;
2.设置PieChartDataSet缩放系数set.selectionShift = 8;
2.扇形区域刚出来的时候动画旋转一定的角度
[self.chartView animateWithXAxisDuration:2.0f easingOption:ChartEasingOptionEaseOutExpo];3.扇形区域折线要显示出来
1.当饼状图带折线时,dataSet.yValuePosition 数值的位置只有设置为 PieChartValuePositionOutsideSlice,折线才会显示,valueLine相关属性才有用
2.    set.drawValuesEnabled = YES;
    set.valueFont = [UIFont systemFontOfSize:20];
    set.valueColors = @[UIColor.redColor,UIColor.blueColor,UIColor.cyanColor];
    set.yValuePosition = PieChartValuePositionOutsideSlice;
    set.valueLineColor = UIColor.greenColor;
4.扇形区域数值百分比格式化
    NSNumberFormatter *pFormatter = [[NSNumberFormatter alloc] init];
    pFormatter.numberStyle = NSNumberFormatterPercentStyle;
    pFormatter.maximumFractionDigits = 1;
    pFormatter.multiplier = @1.f;
    pFormatter.percentSymbol = @" %";
    set.valueFormatter = [[ChartDefaultValueFormatter alloc] initWithFormatter:pFormatter];
5.显示扇形区域的描述文字
   1.设置文字可显示 chartView.drawEntryLabelsEnabled = NO;
   2.每个扇形区域设置文字titles为对应的文字描述
        NSArray *datas = @[@"24",@"74",@"35"];
    NSArray *titles = @[@"Pie1",@"Pie2",@"Pie3"];
    NSMutableArray *array = [NSMutableArray array];
    for (int i = 0; i < datas.count; i++) {
        PieChartDataEntry *entry = [[PieChartDataEntry alloc] initWithValue:[datas[i] integerValue] label:titles[i]];
        [array addObject:entry];
    }
转载请标注来源:https://www.cnblogs.com/qqcc1388/
标签:nsa style top can ict drag 桥接 slice self
原文地址:https://www.cnblogs.com/qqcc1388/p/11172217.html