Office 365中制作报表的方式很多。
这里介绍下使用js获取SharePoint List实现报表的一种方法
资源
- Jquery 1.8.2 http://blog.jquery.com/2012/09/20/jquery-1-8-2-released/
- SPServices http://spservices.codeplex.com/
- Highcharts http://www.highcharts.com/
- underscore.js http://underscorejs.org/
先看效果, 要实现一个饼图
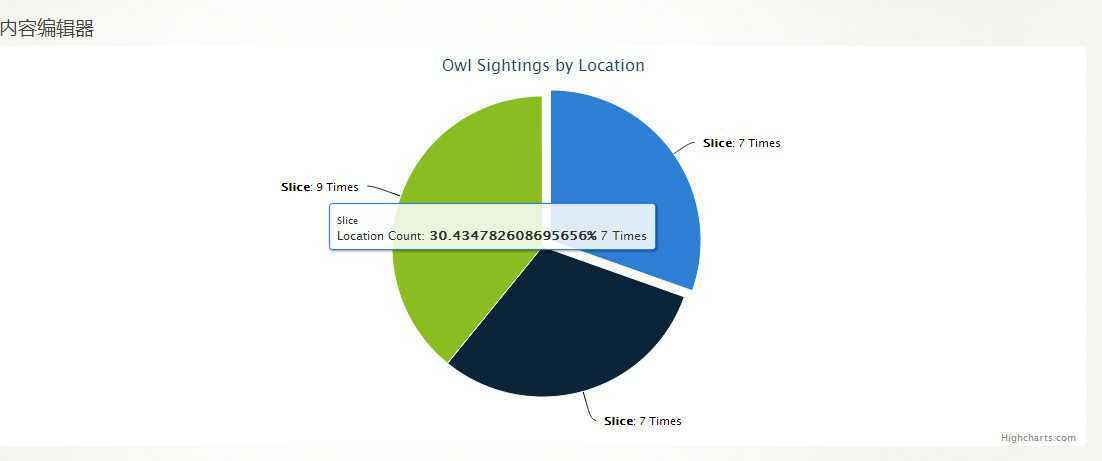
看代码
详细代码解释见原文(原文中的代码有点小问题,修复后的代码如下) http://www.sharepointdeveloperhq.com/2013/05/utilizing-spservices-for-sharepoint-2010-to-create-charts-with-high-charts/
 1 <script src="/sites/target3/Theme/jquery.min.js" type="text/javascript"></script>
 2 <script src="/sites/target3/Theme/highcharts.js" type="text/javascript"></script>
 3 <script src="/sites/target3/Theme/jquery.SPServices-2013.01.js" type="text/javascript"></script>
 4 <script src="/sites/target3/Theme/underscore.js" type="text/javascript"></script>
 5 <script type="text/javascript">
 6     $(document).ready(function () {
 7        $().SPServices({
 8             operation: "GetListItems",
 9             CAMLQuery: "<Query><OrderBy><FieldRef Name=‘Location‘/></OrderBy></Query>",
10             CAMLViewFields: "<ViewFields><FieldRef Name=‘Title‘/><FieldRef Name=‘Date_x0020_of_x0020_Sighting‘/><FieldRef Name=‘Action‘/><FieldRef Name=‘Location‘/></ViewFields>",
11             listName: "owl seen",
12             completefunc: processData
13         });
14     });
15
16     function processData (xData, status) {
17         var owlData = [];
18         $(xData.responseXML).SPFilterNode("z:row").each(function () {
19             owlData.push({
20                 owl:        $(this).attr(‘ows_Title‘),
21                 date:       $(this).attr(‘ows_Date_x0020_of_x0020_Sighting‘),
22                 action:     $(this).attr(‘ows_Action‘),
23                 location:   $(this).attr(‘ows_Location‘)
24             });
25         });
26
27         var chartData = [];
28         var locationData = _.groupBy(owlData, ‘location‘);
29
30         $.each(locationData, function(row) {
31             var locCount = row.length;
32
33             chartData.push( {
34                 name:   row[0].location,
35                 y:      locCount
36             });
37
38         });
39
40         renderChart (chartData);
41     }
42
43     function renderChart (data) {
44         var chart = new Highcharts.Chart({
45             chart: {
46                 renderTo: ‘owlchart‘,
47                 plotBackgroundColor: null,
48                 plotBorderWidth: null,
49                 plotShadow: false
50             },
51             credits: {
52                 enabled: true
53             },
54             title: {
55                 text: ‘Owl Sightings by Location‘
56             },
57             tooltip: {
58                 pointFormat: ‘{series.name}: <b>{point.percentage}%</b> {point.y} Times‘,
59                 percentageDecimals: 1
60             },
61             plotOptions: {
62                 pie: {
63                     allowPointSelect: true,
64                     cursor: ‘pointer‘,
65                     dataLabels: {
66                         enabled: true,
67                         color: ‘#000000‘,
68                         connectorColor: ‘#000000‘,
69                         formatter: function() {
70                             return ‘<b>‘+ this.point.name +‘</b>: ‘+ this.y +‘ Times‘;
71                         }
72                     },
73                 }
74             },
75             series: [{
76                 type: ‘pie‘,
77                 name: ‘Location Count‘,
78                 data: data
79             }]
80         });
81     }
82 </script>
83 <div id="owlchart">????????</div>
Thanks,
Ivan