标签:数据分析 lower port scribe 没有 cluster taf adf arch
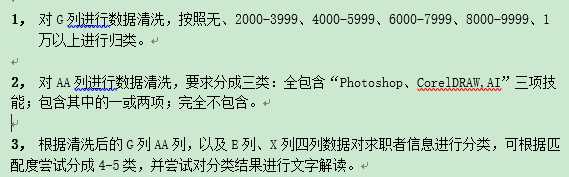
如本考题三个题目所示:
采用本考题提供的数据源:data..xlsx
分析工具:Excel、Jupyter Notebook
环境:Window10
语言:python
#导入数据
import pandas as pd
dataDf = pd.read_excel(‘data.xlsx‘)
#查看数据结构
dataDf.head(2)
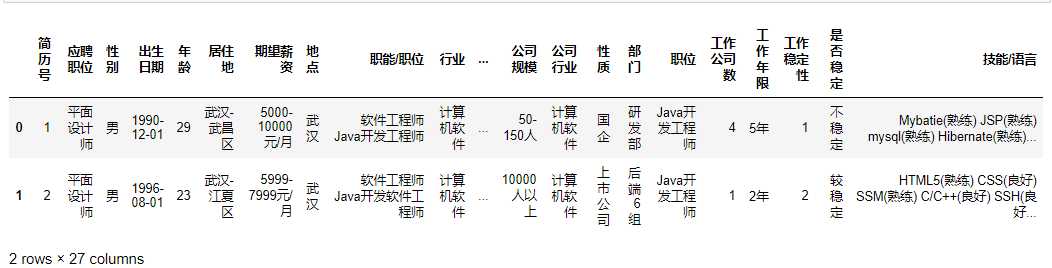
查看两行27列
#获取数据类型列的描述统计信息
dataDf.describe()
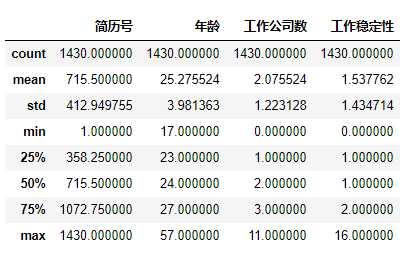
只有简历号;年龄;工作公司数;工作稳定性。这四个字段属于数值类型
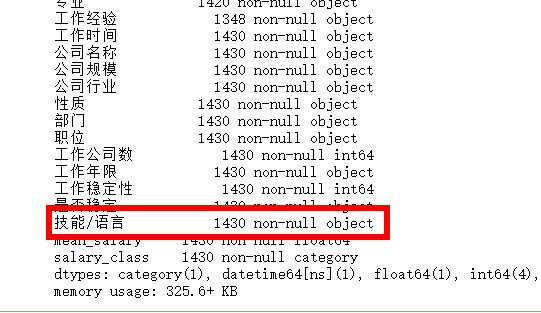
# 查看每一列的数据类型,和数据总数
dataDf.info()
<class ‘pandas.core.frame.DataFrame‘>
RangeIndex: 1430 entries, 0 to 1429
Data columns (total 27 columns):
简历号      1430 non-null int64
应聘职位     1430 non-null object
性别       1430 non-null object
出生日期     1430 non-null datetime64[ns]
年龄       1430 non-null int64
居住地      1430 non-null object
期望薪资     1407 non-null object
地点       1409 non-null object
职能/职位    1430 non-null object
行业       1149 non-null object
工作类型     1430 non-null object
学校       1430 non-null object
办学类型     1430 non-null object
专业       1420 non-null object
工作经验     1348 non-null object
工作时间     1430 non-null object
公司名称     1430 non-null object
公司规模     1430 non-null object
公司行业     1430 non-null object
性质       1430 non-null object
部门       1430 non-null object
职位       1430 non-null object
工作公司数    1430 non-null int64
工作年限     1430 non-null object
工作稳定性    1430 non-null int64
是否稳定     1430 non-null object
技能/语言    578 non-null object
dtypes: datetime64[ns](1), int64(4), object(22)
memory usage: 301.7+ KB
dataDf.info()查询结果表明:
字段说明 总共有1430行,27个字段
其中有6个字段有缺失
期望薪资     1407 non-null object  缺失了1430-1407=23,缺失率23/1430=1.6%)
地点       1409 non-null object    缺失了1430-1409=23,缺失率21/1430=1.5%)
职能/职位    1430 non-null object
行业       1149 non-null object    缺失了1430-1149=281,缺失率281/1430=19.6%)
专业       1420 non-null object    缺失了1430-1420=10,缺失率10/1430=0.7%)
工作经验     1348 non-null object  缺失了1430-1348=82,缺失率82/1430=5.7%)
技能/语言    578 non-null object   缺失了1430-578=852,缺失率852/1430=59.6%)
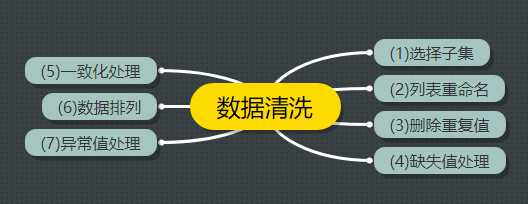
数据清洗的一般步骤如下:
我们把数据清洗的环节放到每一分析问题下进行操作
(1)选择子集
本次分析不需要
(2)列表重命名
本次分析不需要
(3)删除重复值
print(‘删除重复值前大小‘,dataDf.shape)

# 删除重复销售记录
dataDf = dataDf.drop_duplicates()

print(‘删除重复值后大小‘,dataDf.shape)
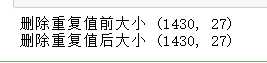
说明,数据集没有重复值
(4)删除/填充缺失值
G列数据除了有Nan还有无
G字段属于
期望薪资     1407 non-null object  缺失了1430-1407=23,缺失率23/1430=1.6%)
讲G列 nan全部填充成无
new_data = dataDf.fillna({‘期望薪资‘:‘无‘})
new_data[‘期望薪资‘]
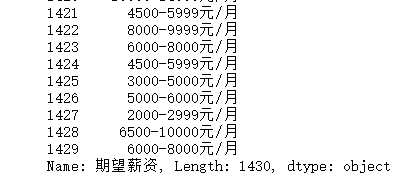
这样不存在缺失值
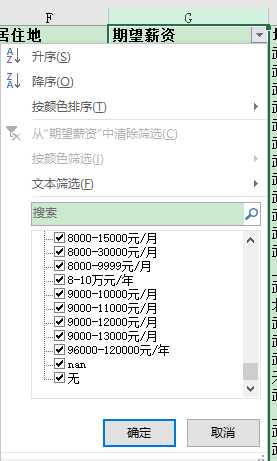
(5)一致化处理:讲不同的单位化为统一
查看各单位类型:
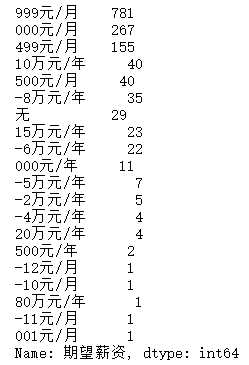
"""将不同单位的薪资形式,转化成统一形式"""
print(new_data[‘期望薪资‘].str[-6:].value_counts())
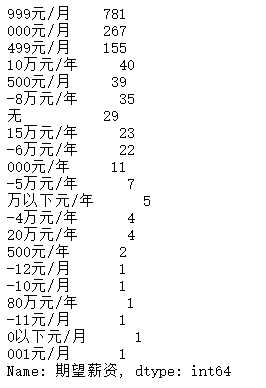
查询得出有如下单位类型:
元/月
万元/月
元年
无
万以下元/年
以下元/月
查询:万以下元/年 ;以下元/月。范围
"""将不同单位的薪资形式,转化成统一形式"""
print(new_data[‘期望薪资‘].str[-10:].value_counts())
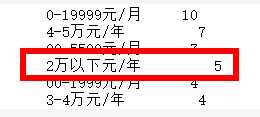
确定为2万以下元/年
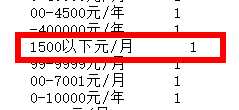
确定为1500以下元/月
讲单位统一:
"""将不规则的薪资形式转化为统一形式"""
new_data.loc[new_data[‘期望薪资‘].str[-6:]==‘万以下元/年‘,‘期望薪资‘]= ‘0-2万元/年‘
new_data.loc[new_data[‘期望薪资‘].str[-5:]==‘以下元/月‘,‘期望薪资‘]=‘0-1500元/月‘

new_data[‘期望薪资‘].str[-6:].value_counts()
统一成四个单位:
元/月
万元/月
元/年
无
将上述四个单位统一成平均月薪(元/月)
import re
def salary_p(salary):
    """将传入的薪资转化成统一的平均月薪"""
    if salary == ‘无‘:
        return 0
    elif re.search(‘元/月‘,salary):
        s = re.findall(‘(\d+)-(\d+)元/月‘,salary)
        # s=[(‘1000‘,‘10000‘)]
        mi,ma = int(s[0][0]),int(s[0][1])
        return (mi+ma)*0.5
    elif re.search(‘万元/年‘,salary):
        s = re.findall(‘(\d+)-(\d+)万元/年‘,salary)
        mi,ma = int(s[0][0]),int(s[0][1])
        return (mi+ma)*0.5*10000/12
    elif re.search(‘元/年‘,salary):
        s = re.findall(‘(\d+)-(\d+)元/年‘,salary)
        mi,ma = int(s[0][0]),int(s[0][1])
        return (mi+ma)*0.5/12
    else:
        return -1
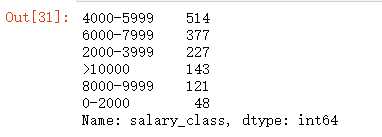
"""新增列保存平均月薪"""
"""apply(),"""
new_data[‘mean_salary‘] = new_data[‘期望薪资‘].apply(salary_p)

"""进行切分,问题中没有考虑0-2000的情况,我们考虑在内"""
bins = [0,2000,4000,6000,8000,10000,1000000]
labels =[‘0-2000‘,‘2000-3999‘,‘4000-5999‘,‘6000-7999‘,‘8000-9999‘,‘>10000‘]
new_data[‘salary_class‘]=pd.cut(new_data[‘mean_salary‘],bins,labels=labels,right=False)

new_data[‘salary_class‘].value_counts()
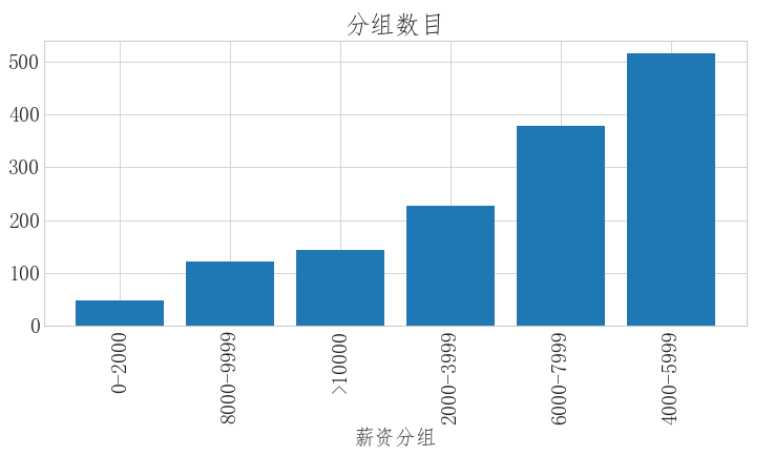
可视化展示:
import matplotlib.pyplot as plt
xl_cnt = new_data.groupby(‘salary_class‘)[‘salary_class‘].count()
xl_cnt = xl_cnt.sort_values()
fig = plt.figure(figsize=(12,5))
plt.bar(xl_cnt.index,xl_cnt.values)
plt.xlabel(‘薪资分组‘)
plt.xticks(rotation=90)
plt.title(‘分组数目‘)

缺失值处理
技能/语言 578 non-null object 缺失了1430-578=852,缺失率852/1430=59.6%)
#问题二:缺失值处理
"""处理缺失值"""
new_data[‘技能/语言‘].fillna(‘无‘,inplace=True)

new_data.info()
技能/语言 缺失值处理完成
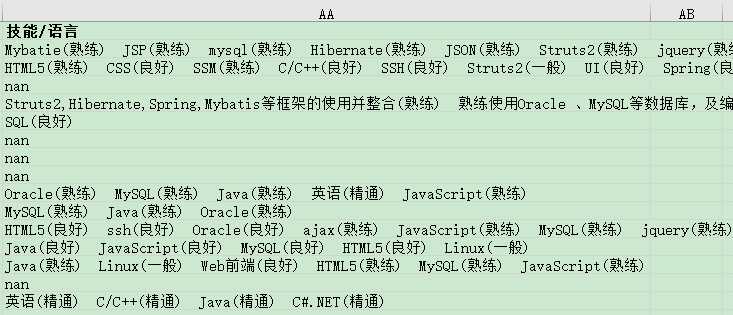
"""提取技能关键词"""
new_data[‘skill‘] = new_data[‘技能/语言‘].str.findall(‘[a-zA-Z0-9\s#.\+/]+‘)
"""处理技能词前后的空格,并统一转化成小写"""
new_data[‘skill2‘]=‘‘
for i in new_data[‘skill‘].index:
    new_data.loc[i,‘skill2‘]=",".join(map(lambda x:x.strip().lower(),new_data.loc[i,‘skill‘]))
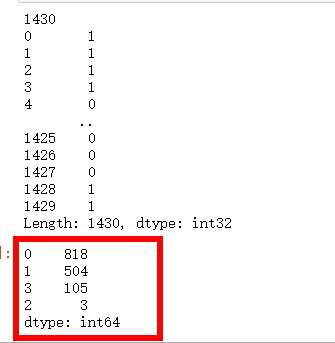
"""将每个人的技能和目标技能进行比较,统计技能数"""
new_data[‘skill_class‘]=0
s = [‘photoshop‘,‘corel draw‘,‘ai‘]
for i in new_data[‘skill2‘].index:
    skill = new_data[‘skill2‘].iloc[i]
    b = 0
    for j in s:
        if j in skill:
            b+=1
    new_data.loc[i,‘skill_class‘]=b
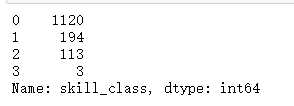
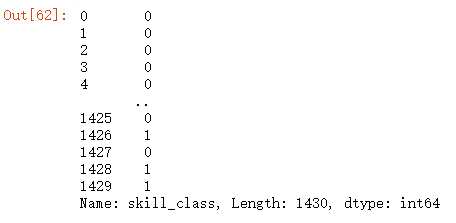
new_data[‘skill_class‘].value_counts()
new_data[‘skill_class‘].map({0:‘全不包含‘,1:‘包含其中一项或两项‘,2:‘包含其中的一项或两项‘,3:‘三项技能全包含‘})
可视化展示:
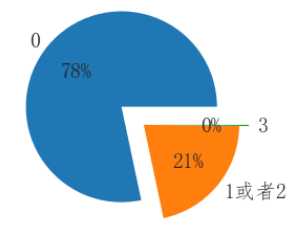
import matplotlib.pyplot as plt

#定义饼状图的标签,标签是列表
labels =[ ‘0‘,‘1或者2‘,‘3‘]

#每个标签占多大,会自动去算百分比
x = [1120,307,3]
explode = (0.3,0,0.1)

# 绘制饼图
plt.pie(x,labels=labels,autopct=‘%.0f%%‘,explode=explode)

# 设置x,y轴刻度一致,这样饼图才能是圆的
plt.axis(‘equal‘)

plt.show()
可见,全不包含占比78%,包含1或者2位21%,全部都包含占比约等于0

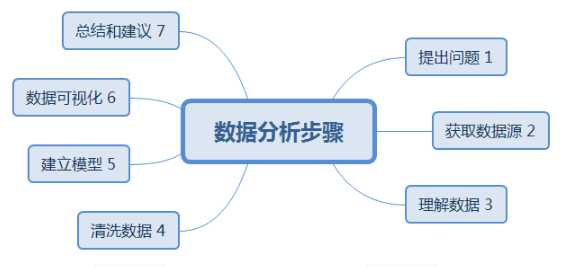
主要步骤如下:
(1)根据题目意思,首先判断是聚类问题,选取Keamns算法
(2)对字段进行清洗,去掉单位
(3)建模分析,选取最佳k值
本题选取k=4进行研究分析
(4)可视化展示,饼图等
2)对字段进行清洗,去掉单位
G/AA/E,清洗后都为数值类型,X列需要进行清洗
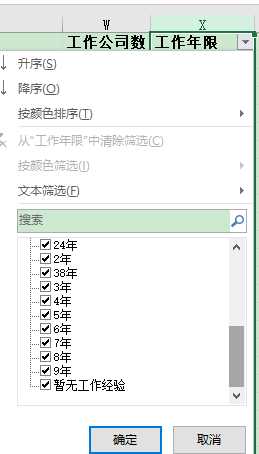
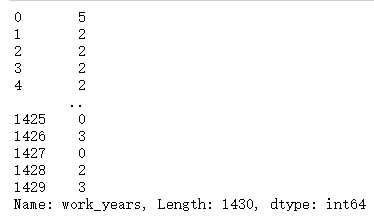
def work_proc(work_y):
    """将传入的薪资转化成统一的平均月薪"""
    if work_y == ‘暂无工作经验‘:
        return 0
    elif re.search(‘年‘,work_y):
        s = re.findall(‘(\d+)年‘,work_y)
        # s=[‘8‘],转换数据类型
        s=int(s[0])
        return s

new_data[‘work_years‘] = new_data[‘工作年限‘].apply(work_proc)
new_data[‘work_years‘]
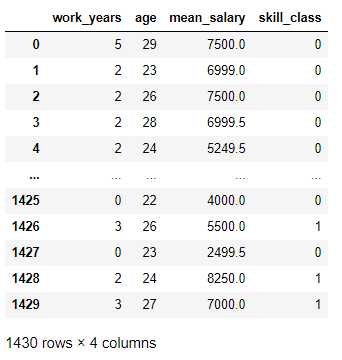
# 薪资用平均薪资代替
new_data = new_data.rename(columns={‘年龄‘:‘age‘})

new_data2 = new_data[[‘work_years‘,‘age‘,‘mean_salary‘,‘skill_class‘]]

new_data2
3)建模分析,选取最佳k值
引入kmeans算法模型
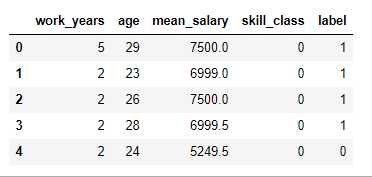
from sklearn.cluster import KMeans

"""调用KMeans算法 进行聚类 ,设定为4类"""
clf = KMeans(n_clusters=4,random_state=0)
"""对数据进行拟合,训练模型"""
clf.fit(new_data2)
"""查看一下分类的结果,返回的数组中每个数字对应了rfm中每一行"""
print(len(clf.labels_))

se = pd.Series(clf.labels_)
print(se)
se.value_counts()
new_data2[‘label‘]=clf.labels_
new_data2.head()
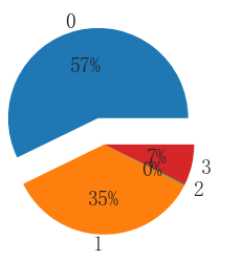
4)可视化展示,饼图等
扇形图:
import matplotlib.pyplot as plt

#定义饼状图的标签,标签是列表
labels =[ ‘0‘,‘1‘,‘2‘,‘3‘]

#每个标签占多大,会自动去算百分比
x = [818,504,3,105]
explode = (0.3,0,0,0)

# 绘制饼图
plt.pie(x,labels=labels,autopct=‘%.0f%%‘,explode=explode)

# 设置x,y轴刻度一致,这样饼图才能是圆的
plt.axis(‘equal‘)

plt.show()
柱形图
xl_cnt2 = new_data2.groupby(‘label‘)[‘label‘].count()
xl_cnt2 = xl_cnt2.sort_values()
fig = plt.figure(figsize=(12,5))
plt.bar(xl_cnt2.index,xl_cnt2.values)
plt.xlabel(‘匹配分组‘)
plt.xticks(rotation=90)
plt.title(‘匹配数目‘)
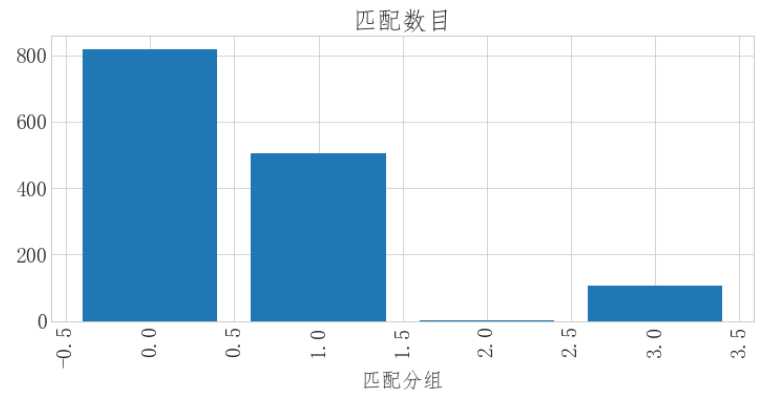
说明:
匹配度0 为818占比57%
匹配度1 为505 占比35%
匹配度2 为3 占比约为0%
匹配度3 为105 占比约为7%
标签:数据分析 lower port scribe 没有 cluster taf adf arch
原文地址:https://www.cnblogs.com/foremostxl/p/12985877.html