标签:_for filebeat pre path highlight https server 服务器配置 col
ELK--使用redis与logstash结合收集数据
kibana
是为elasticsearch提供web可视化界面,为用户提供数据展示
kibana安装
[root\@kibana \~]# ls
anaconda-ks.cfg GeoLite2-City.tar.gz kibana-7.1.1-x86_64.rpm
修改kibana配置文件
#开启端口
#设置侦听端口
#设置elasticsearch主机#设置语言,不用汉化
[root\@kibana \~]# cat /etc/kibana/kibana.yml | grep -v "#" | grep -v "\^\$"
server.port: 5601
server.host: "192.168.122.10"
elasticsearch.hosts: ["http://192.168.122.20:9200","http://192.168.122.30:9200"]
i18n.locale: "zh-CN"
启动服务
1 # systemctl start kibana;systemctl enable kibana;systemctl status kibana
访问测试页面

使用?lebeat收集数据
filebeat.inputs:

>   \- type: log enabled: true paths:

\- /var/log/nginx/access.log filebeat.config.modules:

>   path: \${path.config}/modules.d/\*.yml reload.enabled: false

>   setup.template.settings: index.number_of_shards: 1

setup.kibana: output.logstash:

>   hosts: ["192.168.122.40:5044"]

processors:

-   add_host_metadata: \~

-   add_cloud_metadata: \~
\#cat /etc/filebeat/filebeat.yml# cat /etc/logstash/conf.d/remote_filebeat_nginx.conf input {
> beats {
> port =\> 5044
> host =\> "0.0.0.0"
> }
}
output {
> elasticsearch {
> hosts =\> ["192.168.122.20:9200","192.168.122.30:9200"]
> index =\> "remote_filebeat_nginx_app-%{+YYYY.MM.dd}"
> }
> stdout {
> codec =\> rubydebug
> }
}使用redis与logstash结合收集数据
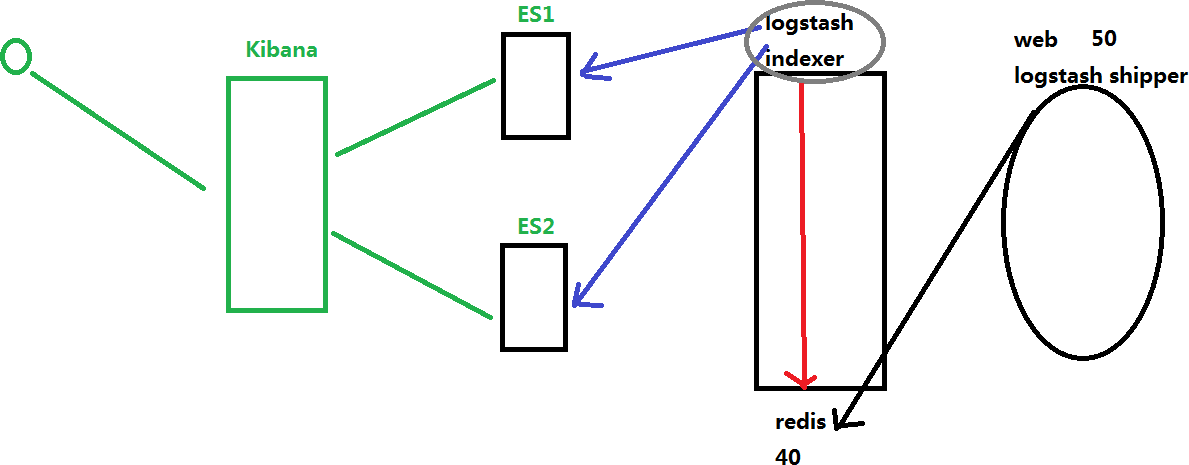
#logstash to redis
#在需要收集nginx日志服务
# cat /etc/logstash/conf.d/logstash_to_redis.conf input {

>   file {

path =\> "/var/log/nginx/access.log"

start_position =\> "beginning"

}

}

filter {

}

output {

>   redis {

>   host =\> ["192.168.122.40:6379"]

>   password =\> "123456"

>   db =\> "0"

>   data_type =\> "list"

>   key =\> "logstashtoredis"

>   }

}

requirepass 123456 \#480 line
#启动服务
#systemctl enable redis #systemctl start redis
#验证
#redis-cli -h 192.168.122.40 -a 123456
\>keys *
#61 line
bind 0.0.0.0
#cat /etc/redis.conf
#在redis服务器上配置
#配置logstash连接es
# cat /etc/logstash/conf.d/logstash_from_redis.conf input {
redis {
host =\> "192.168.122.40"
port =\> 6379
password =\> "123456"
db =\> "0"
data_type =\> "list"
key =\> "logstashtoredis"
}
filter {
}
output {
elasticsearch {
hosts =\> ["http://192.168.122.20:9200","http://192.168.122.30:9200"]
index =\> "logstashtoredis-redisfromlogstash-%{+YYYY.MM.dd}"
}
stdout { codec=\> rubydebug }
}
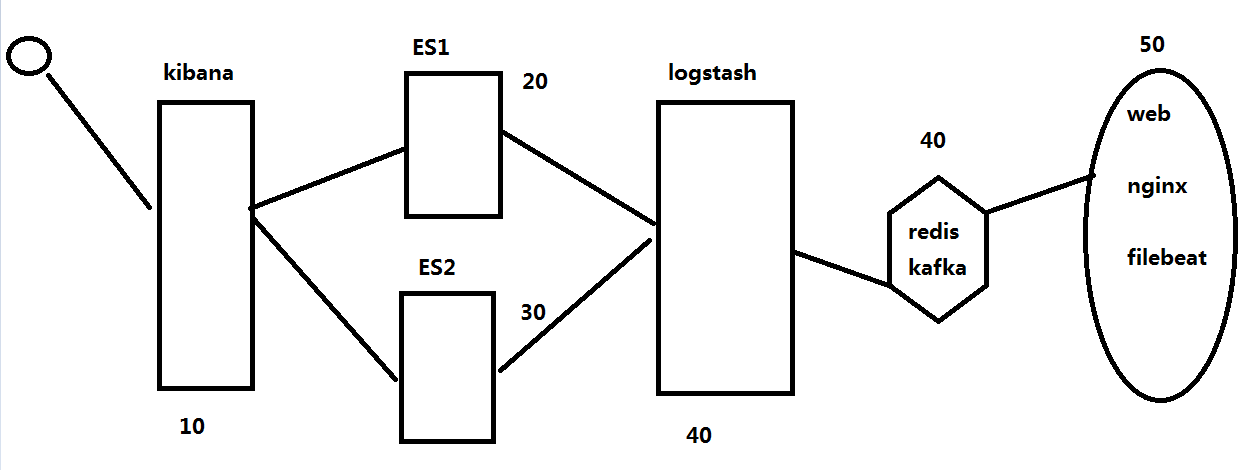
使用?lebeat与redis结合收集数据
1 #在web服务器上使用filebeat收集日志 2
3 ## cat /etc/filebeat/filebeat.yml
4 ###################### Filebeat Configuration
Example ######################### 5
# This file is an example configuration file highlighting only the most
common
# options. The filebeat.reference.yml file from the same directory contains
all the
# supported options with more comments. You can use it as a reference. 9 #
# You can find the full configuration reference here:
#
https://www.elastic.co/guide/en/beats/filebeat/index.html
12
# For more available modules and options, please see the
filebeat.reference.yml sample
# configuration file. 15
16 #========================== Filebeat inputs
17
18 filebeat.inputs:
19
# Each - is an input. Most options can be set at the input level, so
# you can use different inputs for various configurations.
# Below are the input specific configurations. 23
24 - type: log 25
# Change to true to enable this input configuration.
enabled: true 28
# Paths that should be crawled and fetched. Glob based paths.
paths:
- /var/log/nginx/access.log
#- c:\programdata\elasticsearch\logs\* 33
# Exclude lines. A list of regular expressions to match. It drops the lines
that are
# matching any regular expression from the list.
#exclude_lines: [‘\^DBG‘] 37
# Include lines. A list of regular expressions to match. It exports the
lines that are
# matching any regular expression from the list.
#include_lines: [‘\^ERR‘, ‘\^WARN‘] 41
# Exclude files. A list of regular expressions to match. Filebeat drops the
files that
# are matching any regular expression from the list. By default, no files
are dropped.
#exclude_files: [‘.gz\$‘] 45
# Optional additional fields. These fields can be freely picked
# to add additional information to the crawled log files for filtering
#fields:
# level: debug
# review: 1 51
52 ### Multiline options 53
# Multiline can be used for log messages spanning multiple lines. This is
common
# for Java Stack Traces or C-Line Continuation 56
# The regexp Pattern that has to be matched. The example pattern matches
all lines starting with [
#multiline.pattern: \^\[ 59
# Defines if the pattern set under pattern should be negated or not.
Default is false.
#multiline.negate: false 62
# Match can be set to "after" or "before". It is used to define if lines
should be append to a pattern
# that was (not) matched before or after or as long as a pattern is not
matched based on negate.
# Note: After is the equivalent to previous and before is the equivalent to
to next in Logstash
#multiline.match: after 67
68
69 #============================= Filebeat modules
70
filebeat.config.modules:
# Glob pattern for configuration loading
74
# Set to true to enable config reloading
reload.enabled: false 77
# Period on which files under path should be checked for changes
#reload.period: 10s 80
81 #==================== Elasticsearch template setting
========================== 82
setup.template.settings:
index.number_of_shards: 1
#index.codec: best_compression
#_source.enabled: false 87
88 #================================ General
89
# The name of the shipper that publishes the network data. It can be used
to group
# all the transactions sent by a single shipper in the web interface.
#name:
93
# The tags of the shipper are included in their own field with each
# transaction published.
#tags: ["service-X", "web-tier"] 97
# Optional fields that you can specify to add additional information to the
# output.
#fields:
# env: staging 102
103
104 #============================== Dashboards
# These settings control loading the sample dashboards to the Kibana index.
Loading
# the dashboards is disabled by default and can be enabled either by
setting the
# options here or by using the `setup` command.
#setup.dashboards.enabled: false 109
# The URL from where to download the dashboards archive. By default this
URL
# has a value which is computed based on the Beat name and version. For
released
# versions, this URL points to the dashboard archive on the
artifacts.elastic.co
# website.
#setup.dashboards.url:
117
# Starting with Beats version 6.0.0, the dashboards are loaded via the
Kibana API.
# This requires a Kibana endpoint configuration.
setup.kibana:
# Kibana Host
# Scheme and port can be left out and will be set to the default (http and
5601)
# In case you specify and additional path, the scheme is required:
http://localhost:5601/path
# IPv6 addresses should always be defined as: https://[2001:db8::1]:5601
#host: "localhost:5601" 127
# Kibana Space ID
# ID of the Kibana Space into which the dashboards should be loaded. By
default,
# the Default Space will be used.
#space.id:
134
135 # These settings simplify using filebeat with the Elastic Cloud
(https://cloud.elastic.co/).
136
# The cloud.id setting overwrites the `output.elasticsearch.hosts` and
# `setup.kibana.host` options.
# You can find the `cloud.id` in the Elastic Cloud web UI.
#cloud.id:
# The cloud.auth setting overwrites the `output.elasticsearch.username`
and
# `output.elasticsearch.password` settings. The format is
`\<user\>:\<pass\>`.
#cloud.auth:
147
148 # Configure what output to use when sending the data collected by the
beat. 149
150 #-------------------------- Elasticsearch output
#output.elasticsearch:
# Array of hosts to connect to.
#hosts: ["localhost:9200"] 154
# Optional protocol and basic auth credentials.
#protocol: "https"
#username: "elastic"
#password: "changeme" 159
160 #----------------------------- Logstash output
#output.logstash:
# The Logstash hosts
163 #hosts: ["192.168.122.40:5044"]
164
# Optional SSL. By default is off.
# List of root certificates for HTTPS server verifications
#ssl.certificate_authorities: ["/etc/pki/root/ca.pem"] 168
# Certificate for SSL client authentication
#ssl.certificate: "/etc/pki/client/cert.pem" 171
# Client Certificate Key
#ssl.key: "/etc/pki/client/cert.key" 174
175
176
177
178 #----------------------------- redis output
output.redis:
# The redis hosts
181 hosts: ["192.168.122.40"]
182 password: "123456"
key: "filebeattoredis"
db: 0
datatype: list 186
187 ########重点重点###########
188
189
190
191 #================================ Processors
192
193 # Configure processors to enhance or manipulate events generated by the
beat. 194
processors:
- add_host_metadata: \~
- add_cloud_metadata: \~ 198
199 #================================ Logging
200
# Sets log level. The default log level is info.
# Available log levels are: error, warning, info, debug
#logging.level: debug 204
# At debug level, you can selectively enable logging only for some
components.
# To enable all selectors use ["*"]. Examples of other selectors are
"beat",
# "publish", "service".
#logging.selectors: ["*"] 209
210 #============================== Xpack Monitoring
# filebeat can export internal metrics to a central Elasticsearch
monitoring
# cluster. This requires xpack monitoring to be enabled in Elasticsearch.
The
# reporting is disabled by default. 214
# Set to true to enable the monitoring reporter.
#xpack.monitoring.enabled: false 217
# Uncomment to send the metrics to Elasticsearch. Most settings from the
# Elasticsearch output are accepted here as well. Any setting that is not
set is
# automatically inherited from the Elasticsearch output configuration, so
if you
# have the Elasticsearch output configured, you can simply uncomment the
# following line.
#xpack.monitoring.elasticsearch:
226
# This allows to enable 6.7 migration aliases
requirepass 123456 #480 line
#启动服务
#systemctl enable redis #systemctl start redis
#验证
#redis-cli -h 192.168.122.40 -a 123456
\>keys *
#61 line
bind 0.0.0.0
#cat /etc/redis.conf
在redis服务器配置
}
elasticsearch {

>   hosts =\> ["http://192.168.122.20:9200","http://192.168.122.30:9200"]

>   index =\> "filebeattoredis-logstashfromredis-%{+YYYY.MM.dd}"

}

stdout { codec=\> rubydebug }

filter {

}
output {
#在logstash服务器配置
[root\@logstash \~]\# cat /etc/logstash/conf.d/logstash_from_redis.conf input {

>   redis {

>   host =\> "192.168.122.40"

>   port =\> 6379

>   password =\> "123456"

>   db =\> "0"

>   data_type =\> "list"

>   key =\> "filebeattoredis"

>   }

}通过elk系统分析nginx日志
1 # yum -y install nginx
log_format json ‘{ "\@timestamp": "\$time_iso8601", ‘ ‘"remote_addr":
"\$remote_addr", ‘ ‘"remote_user": "\$remote_user", ‘ ‘"body_bytes_sent":
"\$body_bytes_sent", ‘ ‘"request_time": "\$request_time", ‘
‘"status": "\$status", ‘ ‘"request_uri": "\$request_uri", ‘
‘"request_method": "\$request_method", ‘ ‘"http_referer": "\$http_referer",
‘ ‘"http_x_forwarded_for": "\$http_x_forwarded_for", ‘ ‘"http_user_agent":
"\$http_user_agent"}‘;access_log /var/log/nginx/access.log json;
#访问并查看日志
main ‘\$remote_addr - \$remote_user [\$time_local] "\$request" ‘ ‘\$status
\$body_bytes_sent "\$http_referer" ‘‘"\$http_user_agent" "\$http_x_forwarded_for"‘;
http {
log_format
#对nginx日志格式化
# systemctl start redis ; systemctl enable redis ; systemctl status redis
# redis-cli -h 192.168.122.40 -a 123456
192.168.122.40:6379\> keys *
1) "filebeattoredis"
192.168.122.40:6379\> llen filebeattoredis
(integer) 5
#480 line
requirepass 123456
# cat /etc/redis.conf | grep -v "#" | grep -v "\^\$"
bind 192.168.122.40 #61 line
# cat /etc/filebeat/filebeat.yml | grep -v "#" | grep -v "\^\$"
filebeat.inputs:
- type: log enabled: true paths:
- /var/log/nginx/access.log filebeat.config.modules:
path: \${path.config}/modules.d/*.yml reload.enabled: false
output.redis:
hosts: ["192.168.122.40"]
password: "123456" key: "filebeattoredis" db: 0
datatype: list processors:
add_host_metadata: \~
# systemctl start filebeat ; systemctl enable filebeat ; systemctl status
filebeat
#使用filebeat收集日志,存在redis中
# yum -y install filebeat
#配置logstash,传入es
]# cat /etc/logstash/conf.d/logstash_from_redis.conf
input {
redis {
5 host =\> "192.168.122.40"
6 port =\> 6379
7 password =\> "123456"
8 db =\> "0"
data_type =\> "list"
key =\> "filebeattoredis"
}
}
filter {
}
output {
elasticsearch {
hosts =\> ["http://192.168.122.20:9200","http://192.168.122.30:9200"]
index =\> "filebeattoredis-logstashfromredis-%{+YYYY.MM.dd}"
}
stdout { codec=\> rubydebug }
}
]# /usr/share/logstash/bin/logstash --path.settings /etc/logstash -f
/etc/logstash/conf.d/logstash_from_redis.conf
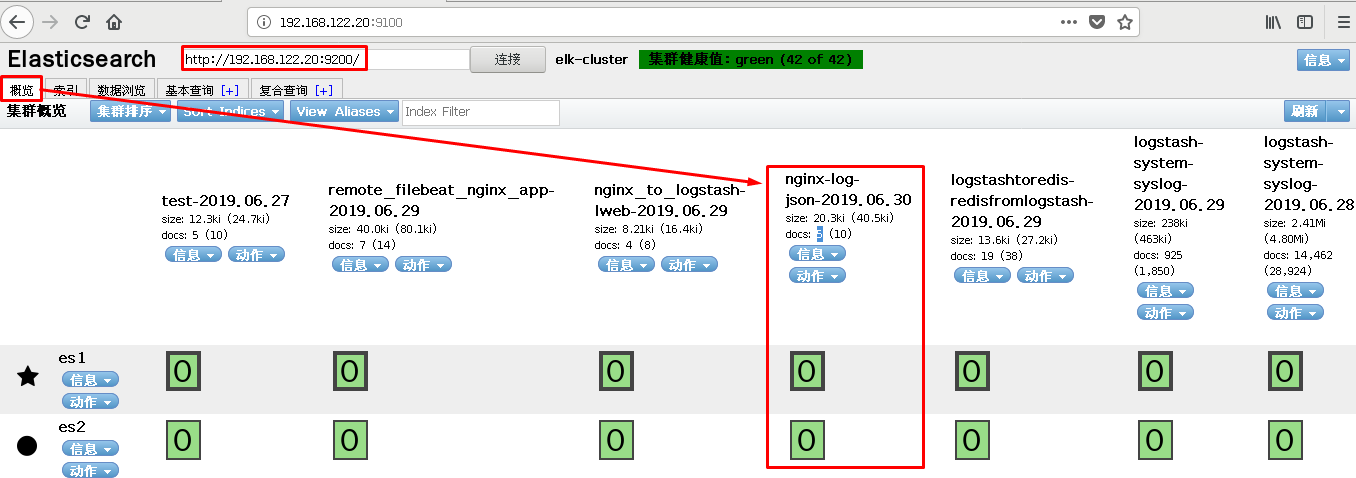
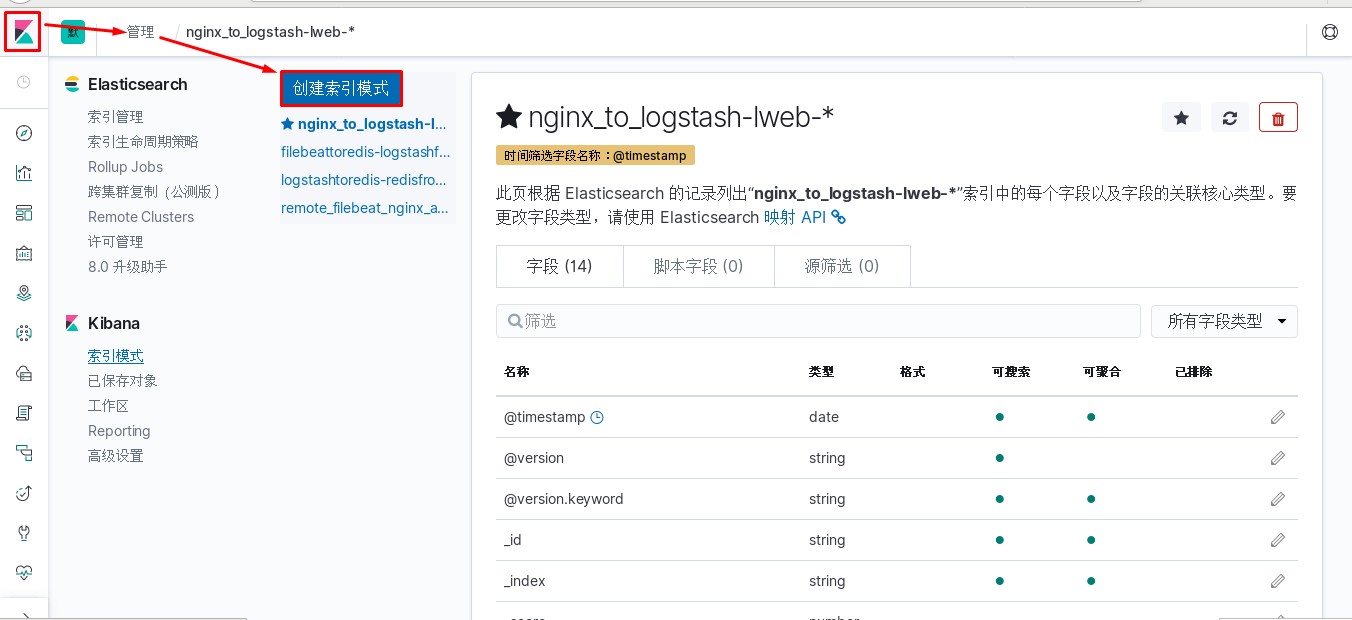
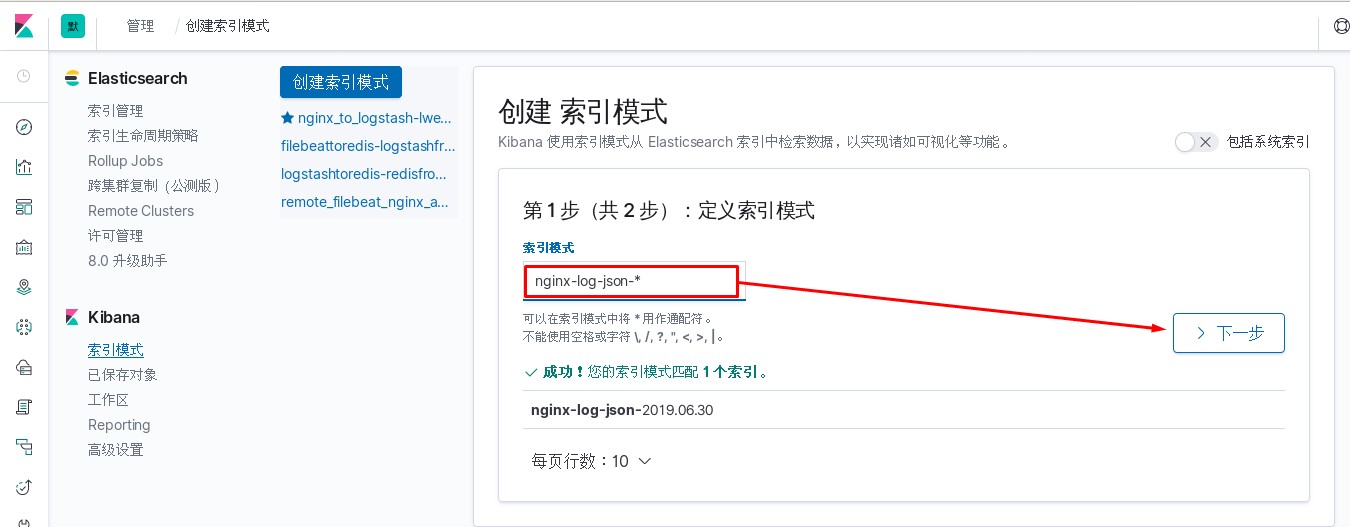
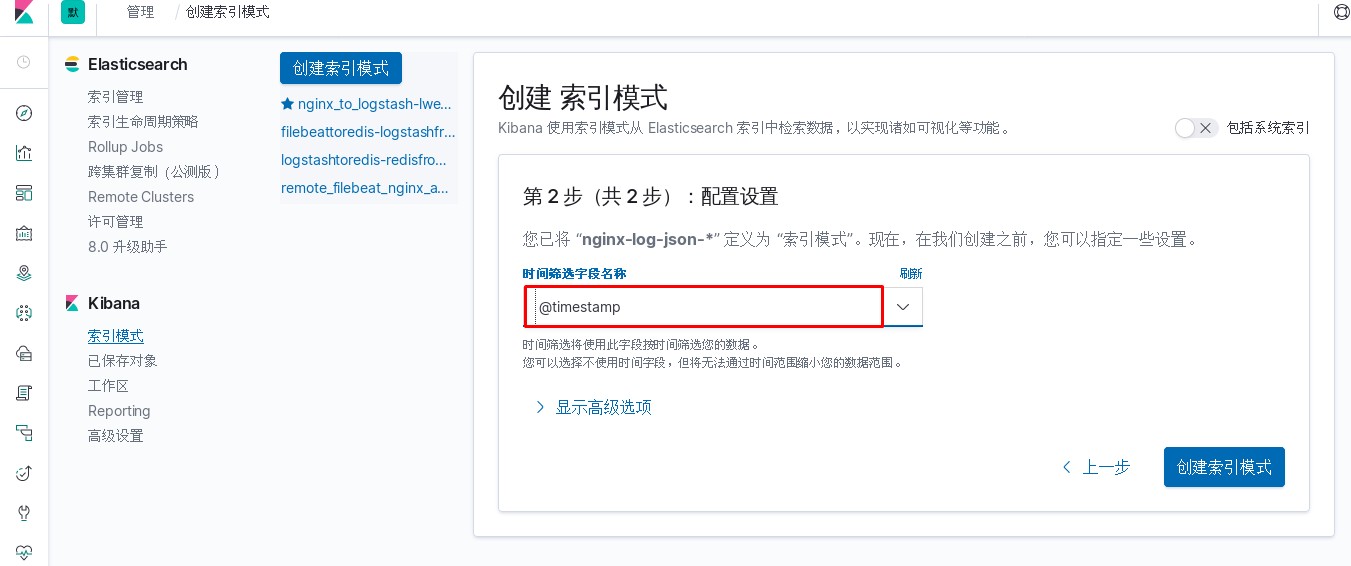
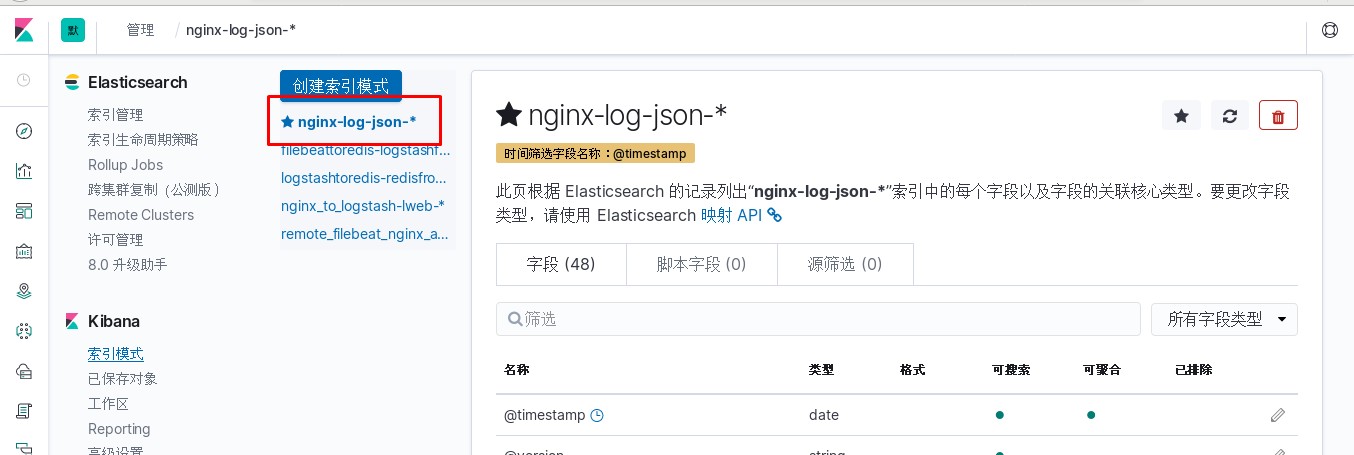
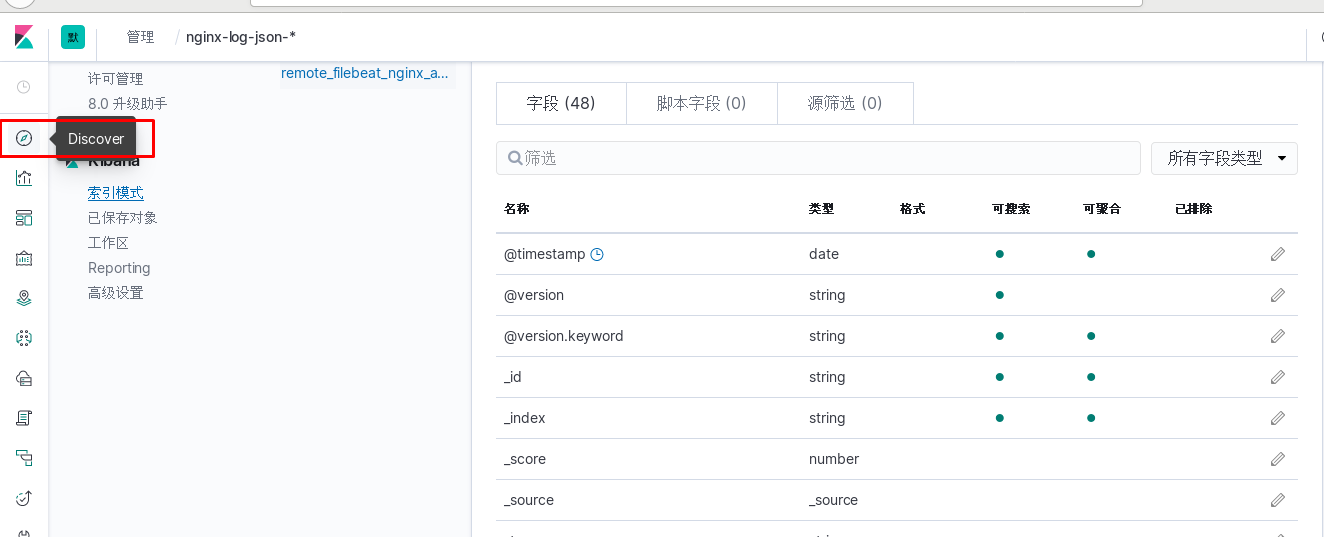
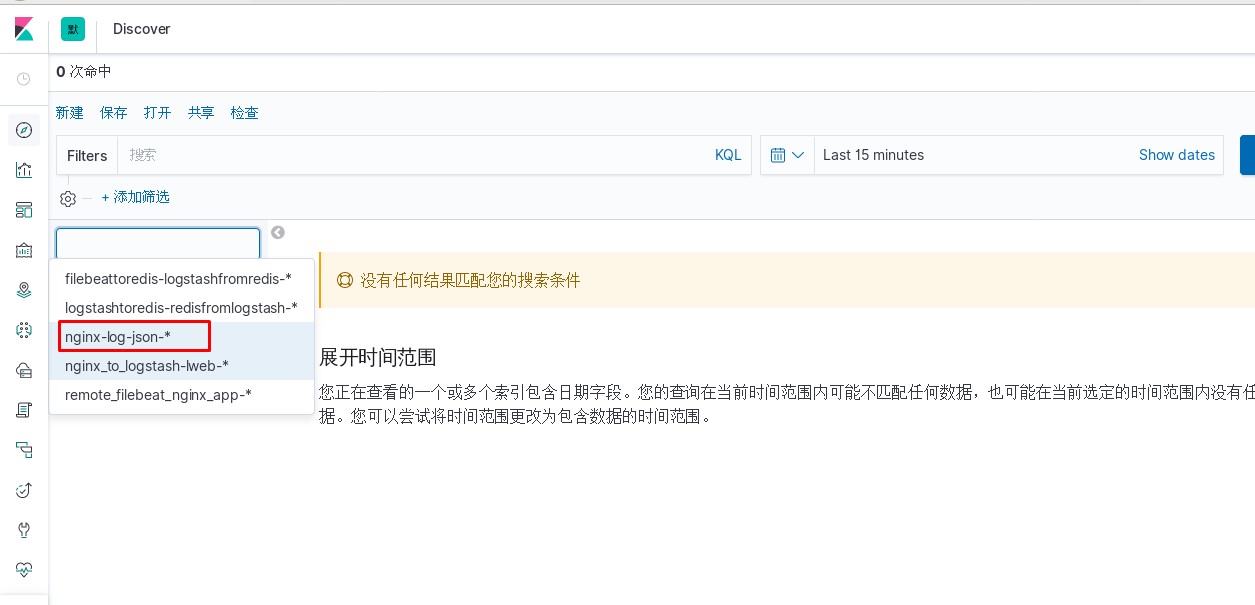
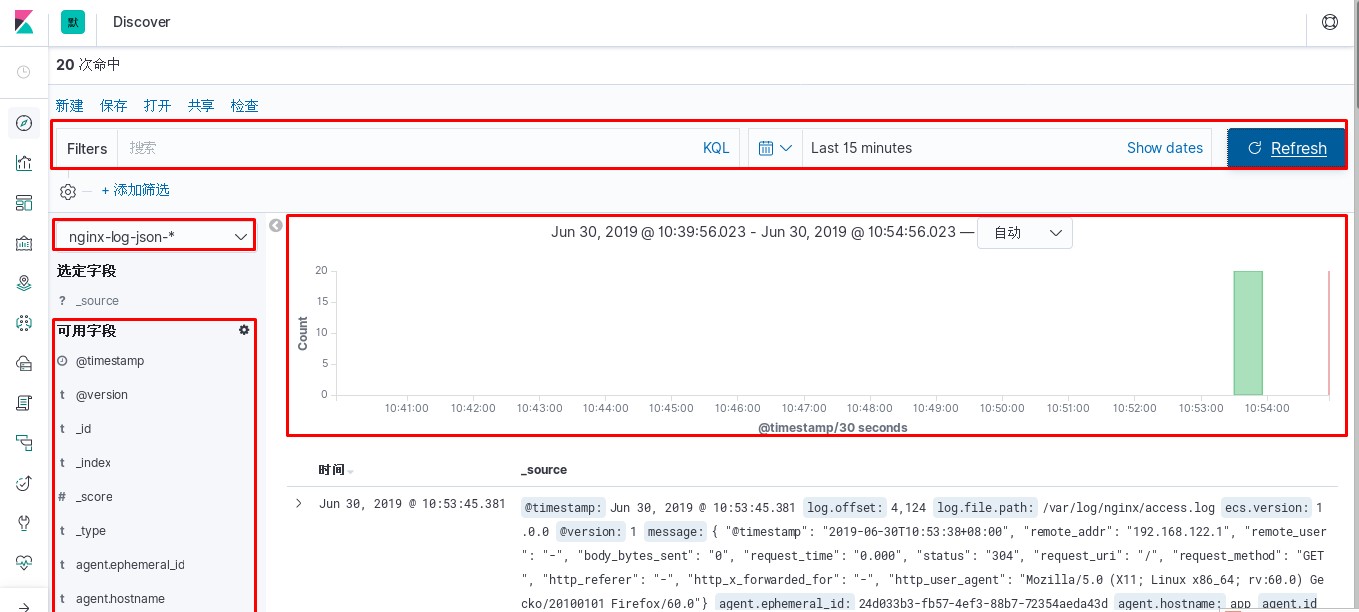
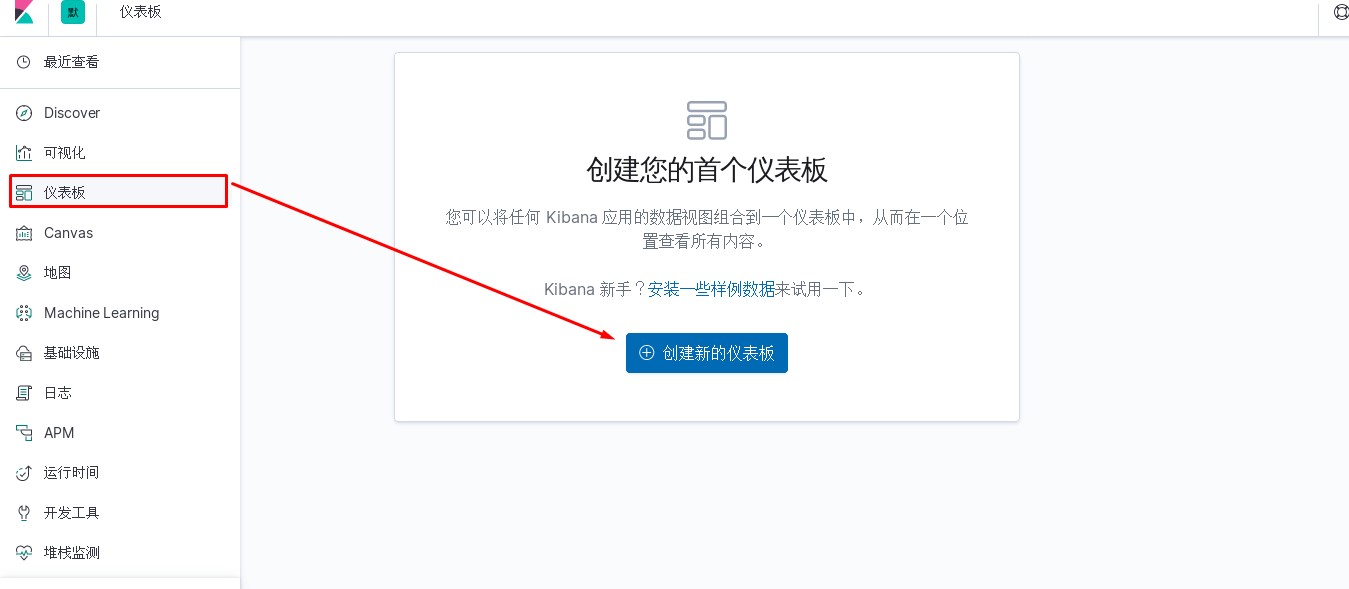
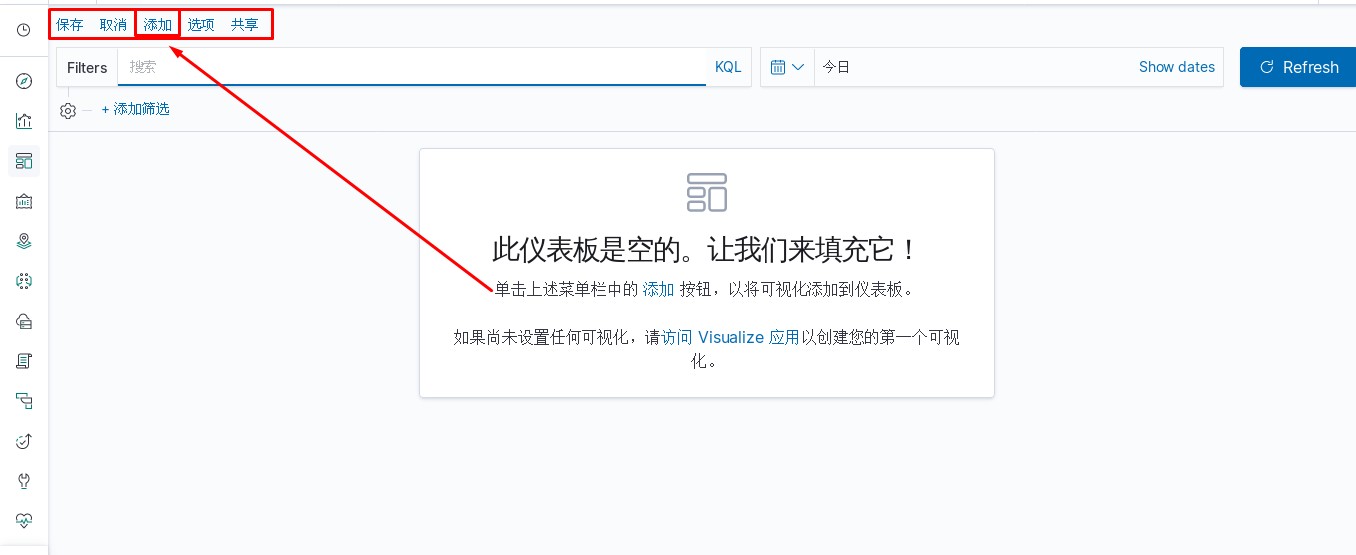
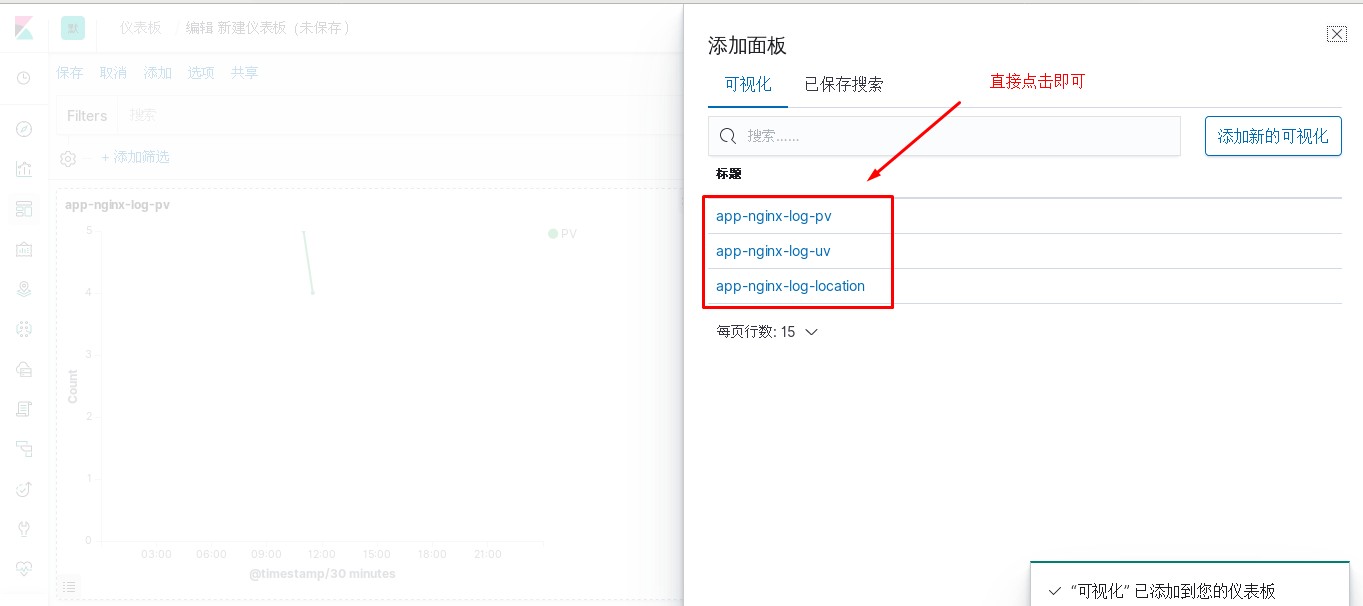
进入kibana进行操作
使用logstash对nginx日志进行过滤
# echo \> /var/log/nginx/access.log
#清空日志
/var/log/nginx/access.log main;
access_log
main ‘\$remote_addr - \$remote_user [\$time_local] "\$request" ‘ ‘\$status
\$body_bytes_sent "\$http_referer" ‘‘"\$http_user_agent" "\$http_x_forwarded_for"‘;
http {
log_format
#nginx日志
#filebeat配置文件
[root\@app \~]# cat /etc/filebeat/filebeat.yml
filebeat.inputs:
- type: log
enabled: true
paths:
fields: app: www
type: nginx
fields_under_root: true
output.redis:
hosts: ["192.168.122.40"]
password: "123456" key: "filebeat" db: 0
datatype: list
1 #redis
2 192.168.122.40:6379\> keys *
3 1) "filebeat"
4 192.168.122.40:6379\> llen filebeat
5 (integer) 1 6
#使用logstash grok插件完成对nginx日志格式化
# cat /etc/logstash/conf.d/logstash_nginx_format.conf input {
redis {
host =\> "192.168.122.40"
port =\> 6379
password =\> "123456"
db =\> "0"
data_type =\> "list" key =\> "filebeat"
}
}
filter {
if [app] == "www" {
if [type] == "nginx" { grok {
match =\> {
19 "message" =\> "%{IPV4:remote_addr} - (%{USERNAME:remote_user}|-) \[%
{HTTPDATE:time_local}\] \"%{WORD:request_method}
%{URIPATHPARAM:request_uri} HTTP/%{NUMBER:http_protocol}\" %{NUMBER:http_status} %{NUMBER:body_bytes_sent}
\"%{GREEDYDATA:http_referer}\" \"%{GREEDYDATA:http_user_agent}\" \"(%
{IPV4:http_x_forwarded_for}|-)\"" 20 }
21 overwrite =\> ["message"] 22 }
geoip {
source =\> "remote_addr"
target =\> "geoip"
database =\> "/opt/GeoLite2-City.mmdb"
add_field =\> ["[geoip][coordinates]", "%{[geoip][longitude]}"]
add_field =\> ["[geoip][coordinates]", "%{[geoip][latitude]}"] 29 }
date {
locale =\> "en"
match =\> ["time_local", "dd/MMM/yyyy:HH:mm:ss Z"] 33 }
mutate {
convert =\> ["[geoip][coordinates]", "float"] 36 }
output {
elasticsearch {
43 hosts =\> ["http://192.168.122.20:9200","http://192.168.122.30:9200"]
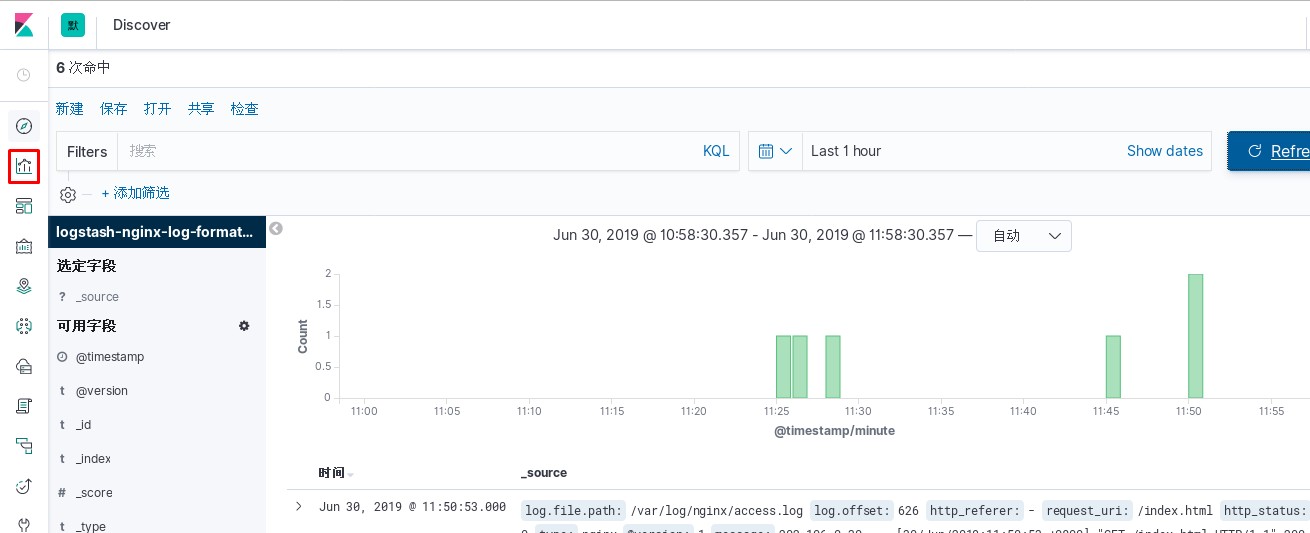
44 index =\> "logstash-nginx-log-format-%{type}-%{+YYYY.MM.dd}" 45 }
46 stdout{codec =\> rubydebug } 47 }
48
49
50
51
52 # /usr/share/logstash/bin/logstash --path.settings /etc/logstash -f
/etc/logstash/conf.d/logstash_nginx_format.conf
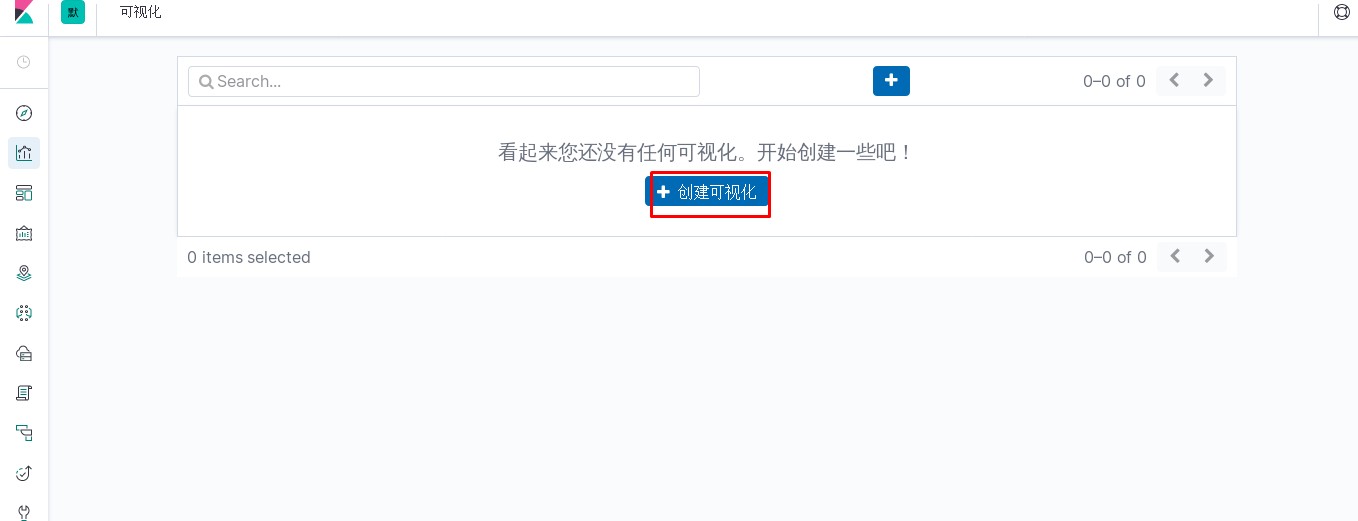
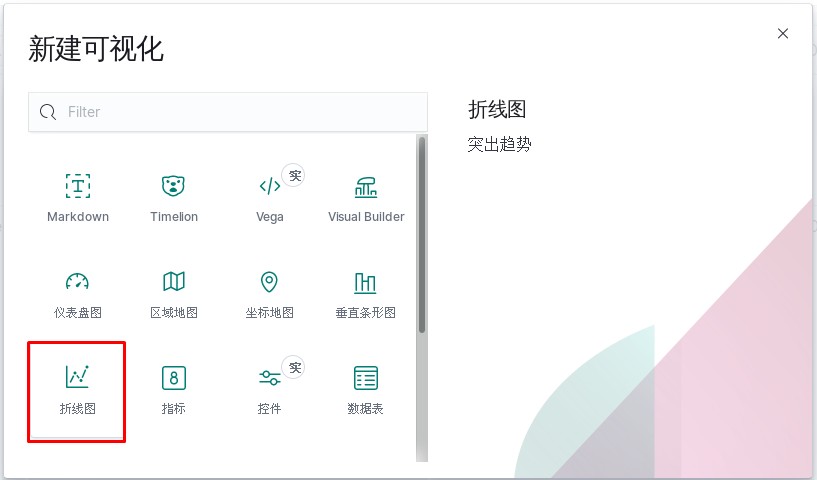
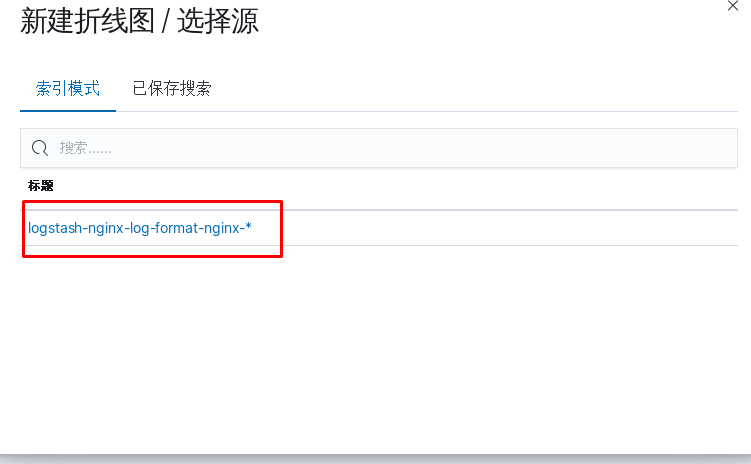
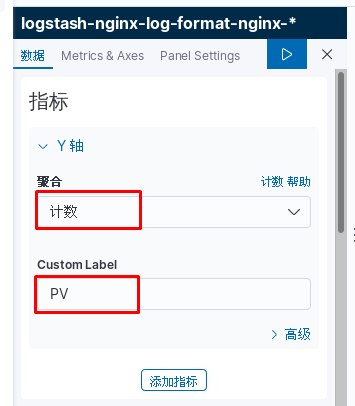
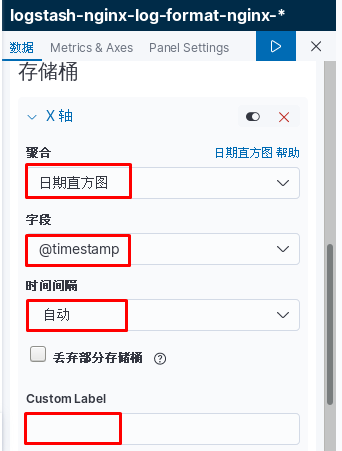
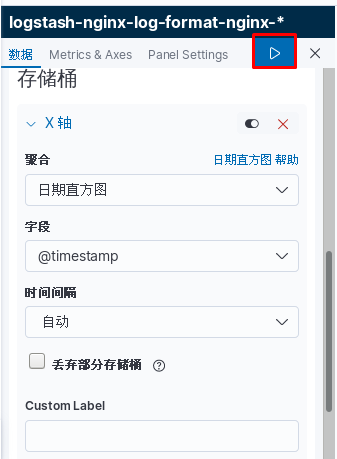
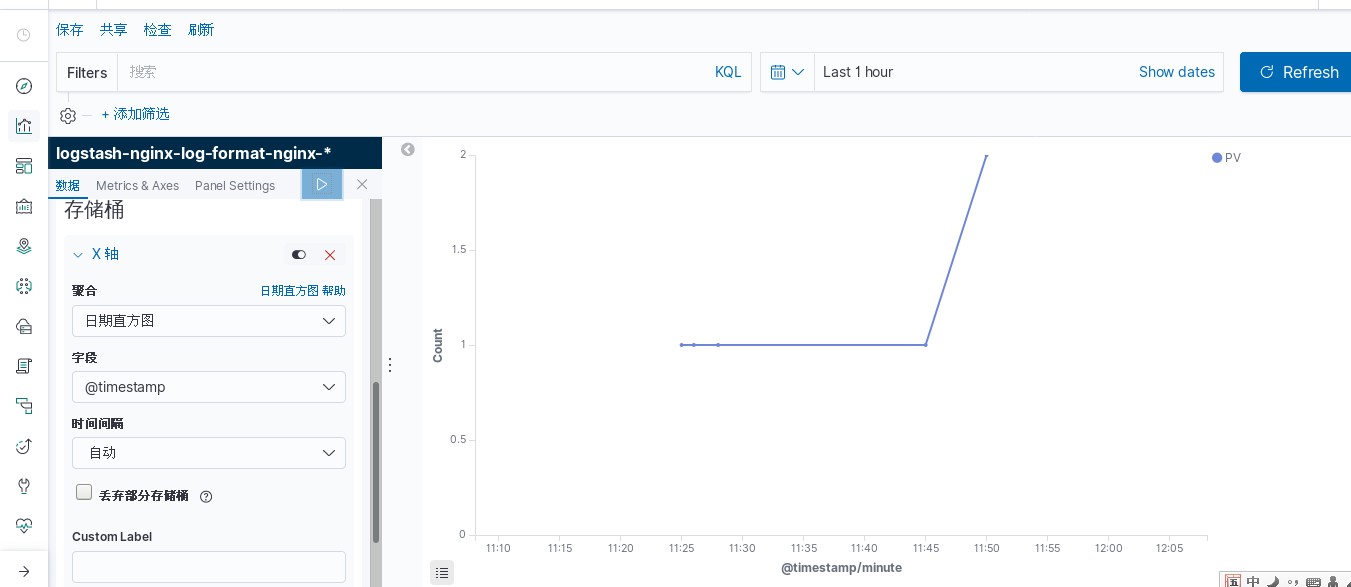
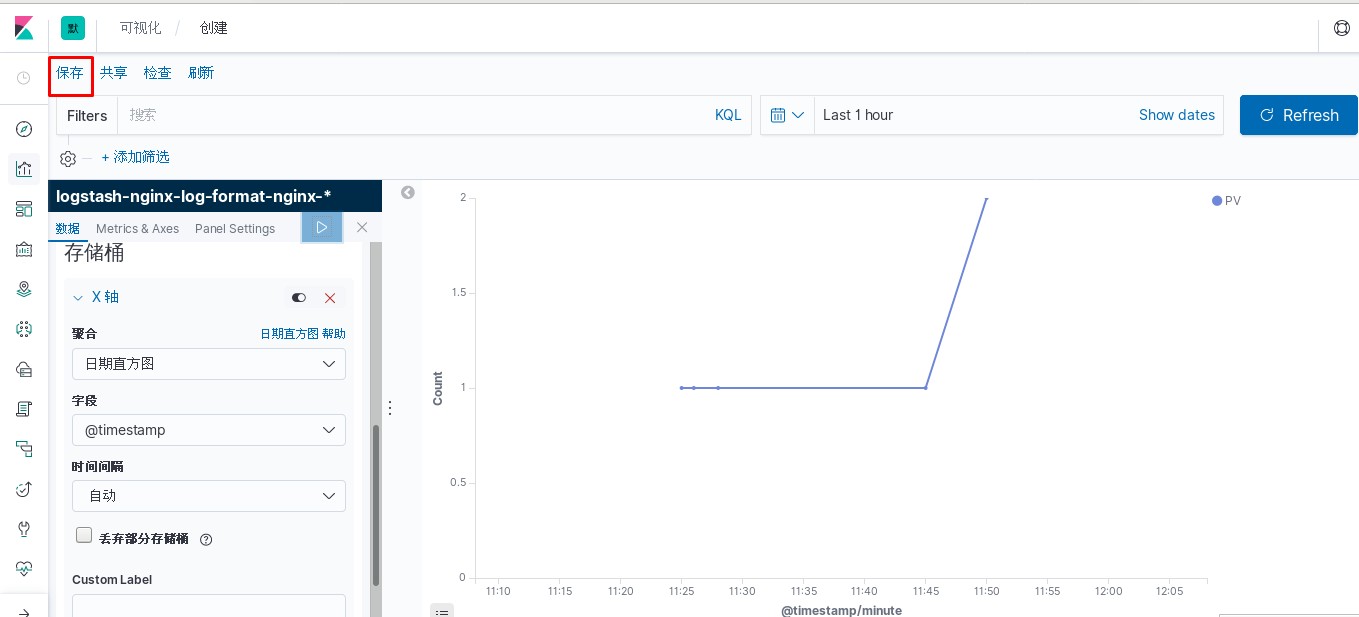
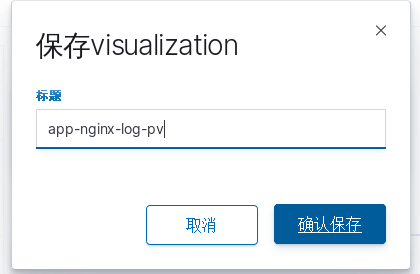
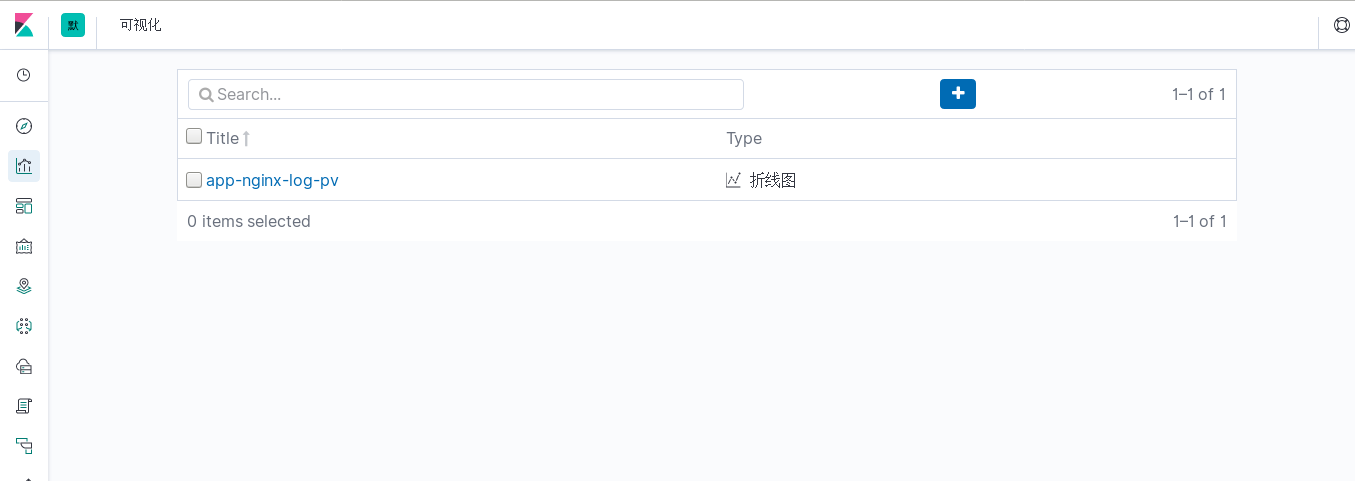
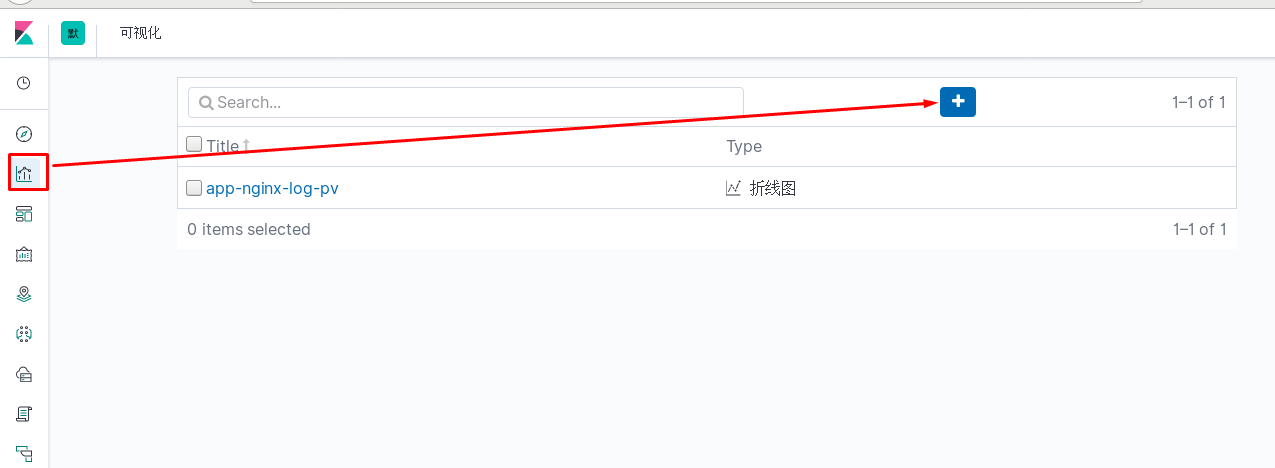
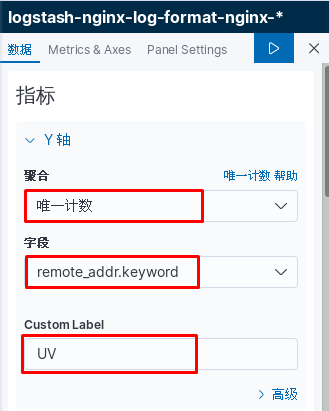
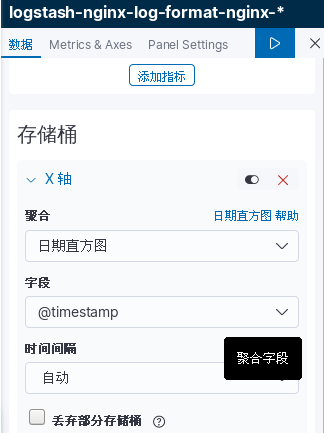
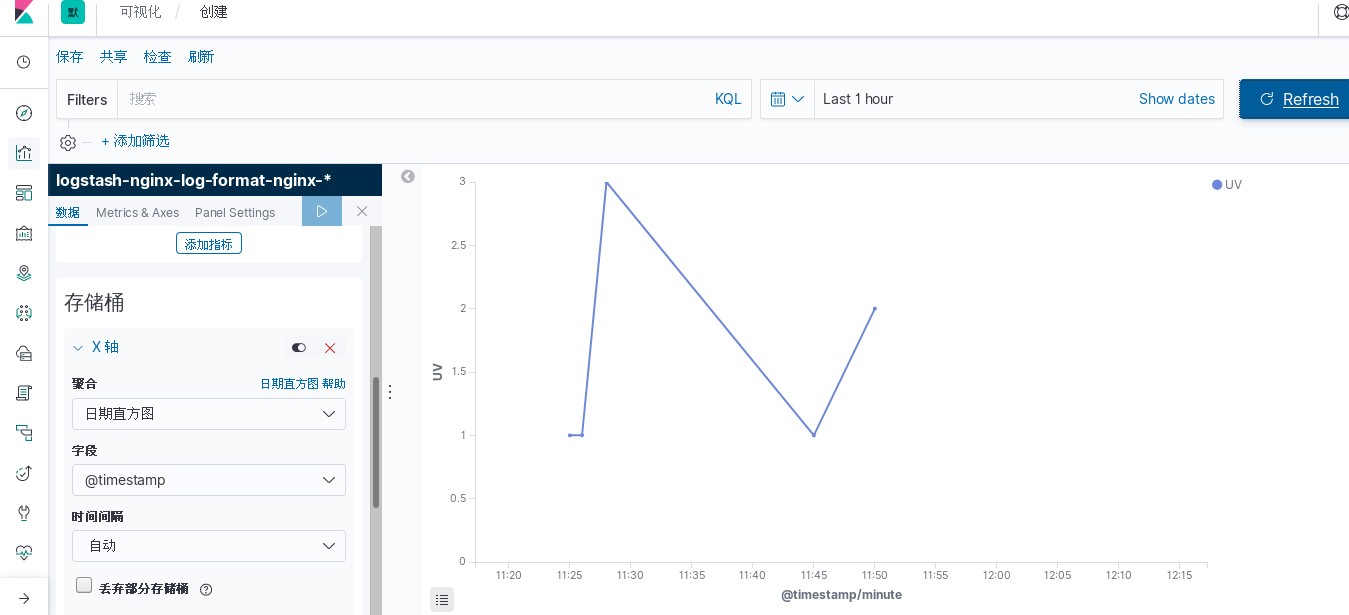
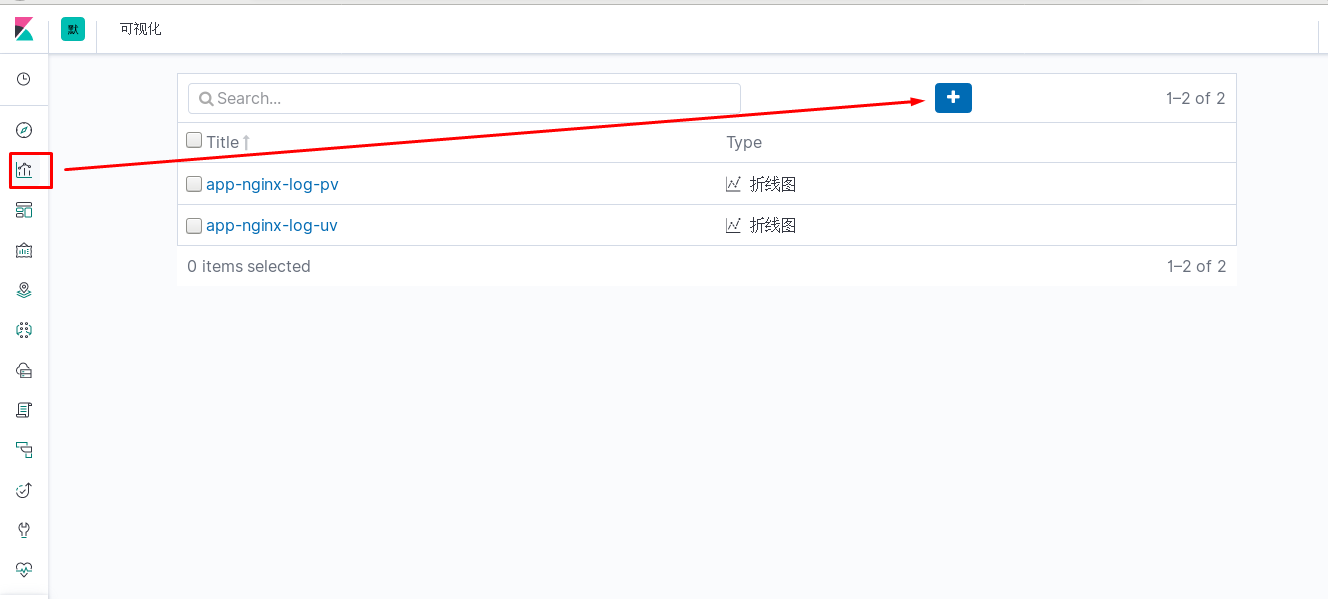
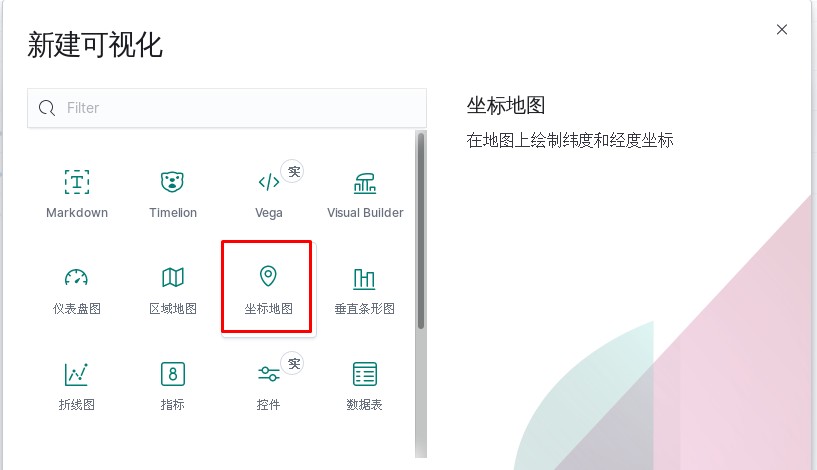
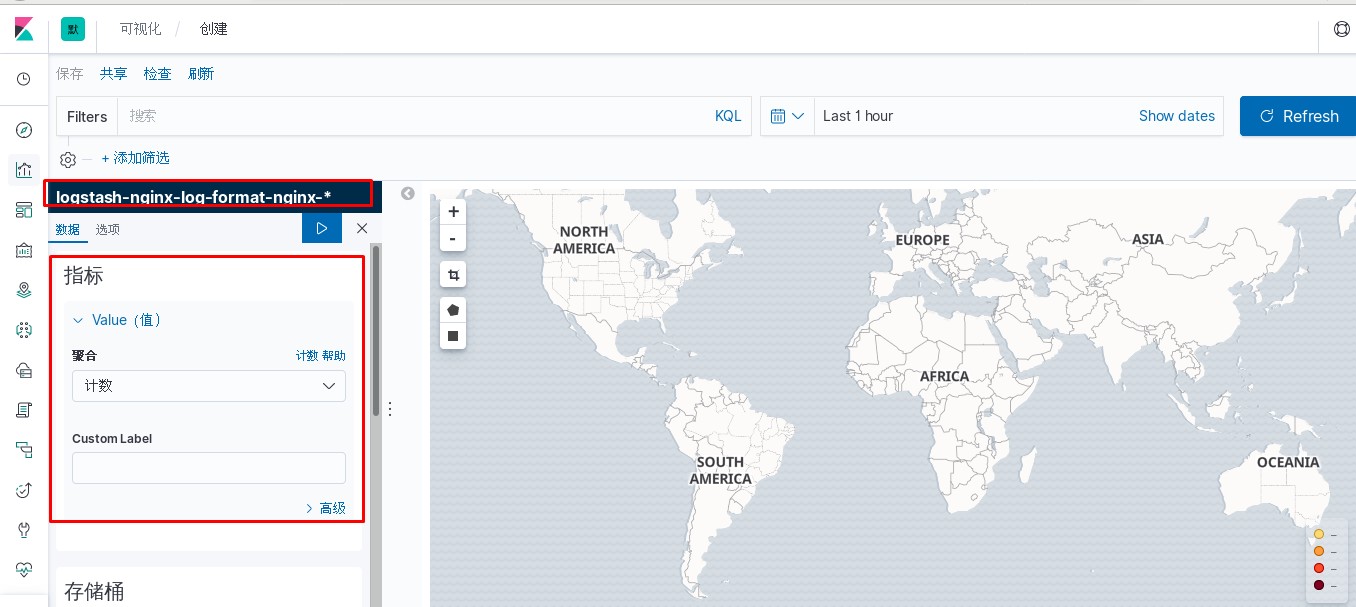
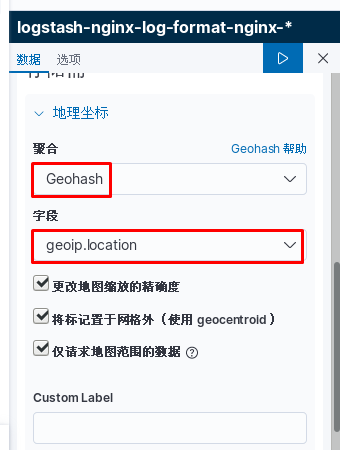
kibana中操作nginx日志视图

ELK专题(3)使用redis与logstash结合收集数据
标签:_for filebeat pre path highlight https server 服务器配置 col
原文地址:https://blog.51cto.com/14625831/2549446