标签:数字 正态分布 cell NPU 影响 透明 width 视图 16px
# 导入numpy数组
import numpy as np

# 导入Matplotlib
import matplotlib.pyplot as plt

# 导入三维坐标轴图
from mpl_toolkits.mplot3d import Axes3D as plt_3d
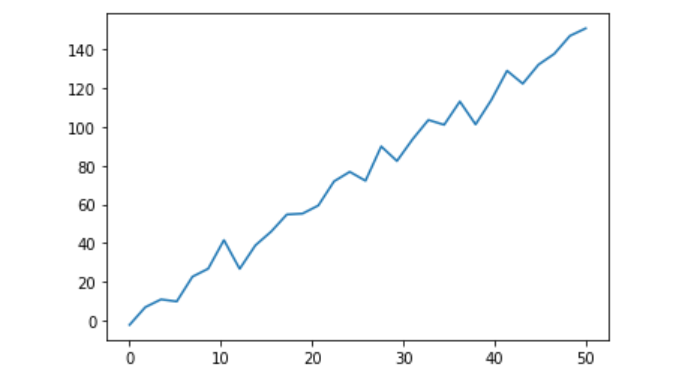
# 等距离线性生成(0,50)的30个x数据
x = np.linspace(0, 50, 30)

# 生成y加上随机偏移量
y = 3 * x + np.random.randn(30)*5

# 生成连续图
plt.plot(x, y)

# 显示图形,在Jupyter中有没有这句都不影响
plt.show()
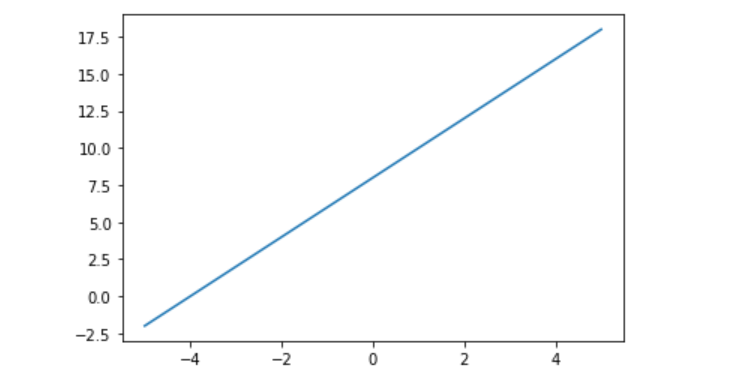
# 等距离线性生成(0,50)的30个x数据
x = np.linspace(-5, 5, 30)

# 两种不同的关系式
y1 = 2*x + 8
y2 = x**2 - 3
# 使用一个图片框
plt.figure()
plt.plot(x, y1)
plt.show()
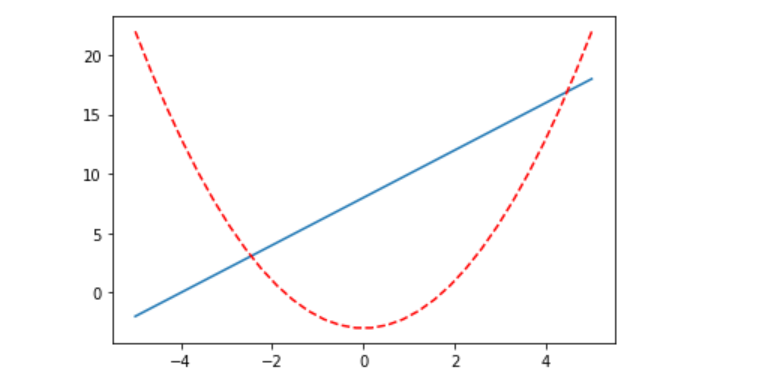
# 一个图片框也可以多个关系图
plt.figure()
plt.plot(x, y1)

# color=红色, linestyle=线条类型
plt.plot(x, y2, color=‘red‘, linestyle=‘--‘)
plt.show()
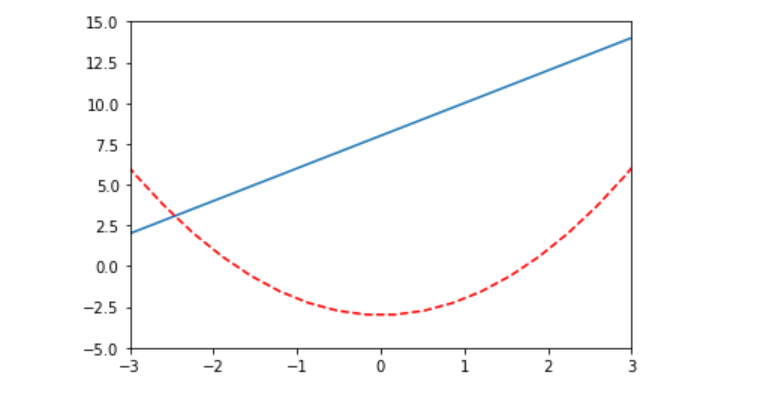
# 新生成一个图片框
plt.figure()

# 限制图片框的坐标限
plt.xlim((-3, 3))
plt.ylim((-5, 15))
plt.plot(x, y1)
plt.plot(x, y2, color=‘red‘, linestyle=‘--‘)
plt.show()
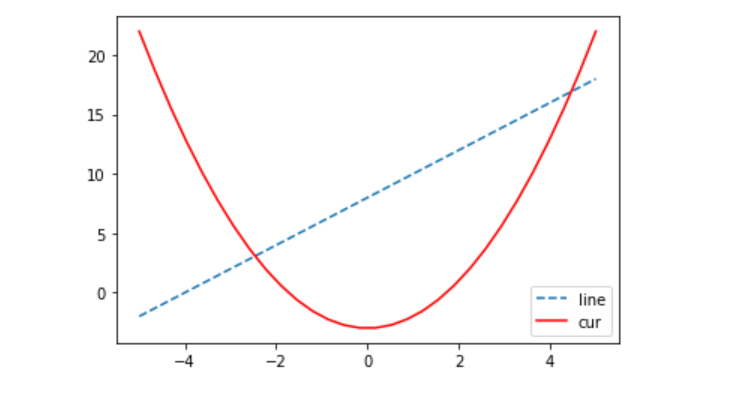
# 等距离线性生成(0,50)的30个x数据
x = np.linspace(-5, 5, 30)

# 两种不同的关系式
y1 = 2*x + 8
y2 = x**2 - 3
# label=图标注解
plt.plot(x, y1, label=‘line‘, linestyle=‘--‘)
plt.plot(x, y2, label=‘cur‘, color=‘r‘)

# 显示图标
plt.legend()
plt.show()
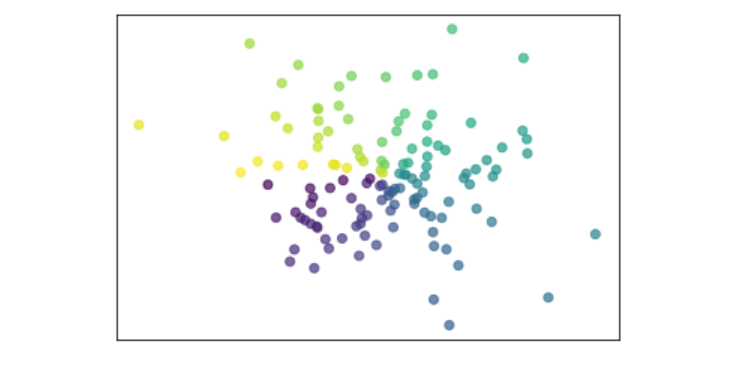
size = 128
# normal正态分布(均值,方差,数量)
x = np.random.normal(0, 1, size)
y = np.random.normal(0, 1, size)
color = np.arctan2(y, x)

# 设置两个坐标轴为空,即去除数字
plt.xticks(())
plt.yticks(())

# alpha: 透明度
plt.scatter(x, y, c=color, alpha=0.7)
plt.show()
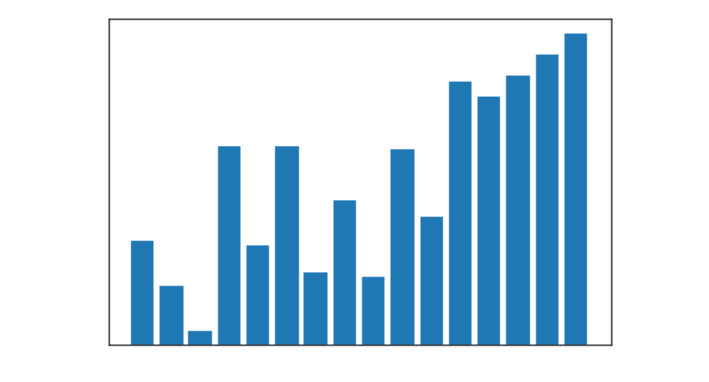
size = 16
x = np.arange(size)

# 随便得出y值
y = x + np.random.randn(16)*(np.random.randint(16-x))

# 处理y为负值的情况
for i in range(16):
    if y[i]<0:
        y[i] = -y[i]

# 设置两个坐标轴为空,即去除数字
plt.xticks(())
plt.yticks(())

# 柱状图
plt.bar(x, y)
plt.show()
arr = np.random.randn(9).reshape(3, 3)

# Image图片
plt.imshow(arr, origin=‘upper‘, cmap=‘bone‘, interpolation=‘nearest‘)

# 颜色棒
plt.colorbar()

# 设置两个坐标轴为空,即去除数字
plt.xticks(())
plt.yticks(())
plt.show()

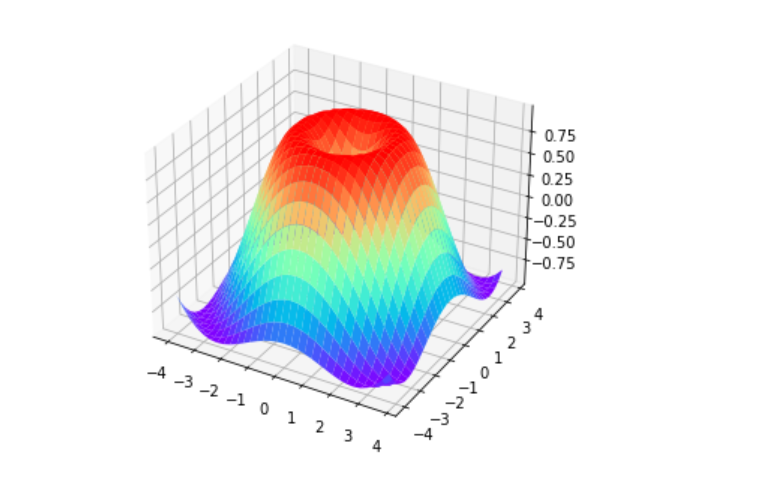
fig = plt.figure()

# 生成3D视图对象
ax = plt_3d(fig)

# x、y、z 数值
x = np.arange(-4, 4, 0.25)
y = np.arange(-4, 4, 0.25)
x, y = np.meshgrid(x, y)
R = np.sqrt(x**2 + y**2)

z = np.sin(R)

ax.plot_surface(x, y, z, cmap=plt.get_cmap(‘rainbow‘))

plt.show()
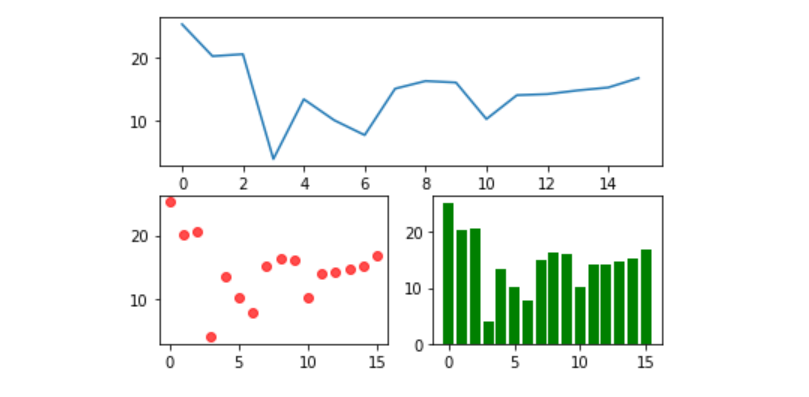
plt.figure()

# 整个figure分成 2*2 个,即两行两列,相当于讲一个figure中分割成四个小的figure,然后在里面绘图

# 第一张小图,占据两格
plt.subplot(2, 1, 1)
x = np.arange(16)
y = x + np.abs(np.random.randn(16)*(16-x))
# 绘图
plt.plot(x, y)

# 第二张小图
plt.subplot(2, 2, 3)
plt.scatter(x, y, color=‘r‘, alpha=0.7)

# 第三张小图
plt.subplot(2, 2, 4)
plt.bar(x, y, color=‘g‘)

plt.show()
标签:数字 正态分布 cell NPU 影响 透明 width 视图 16px
原文地址:https://www.cnblogs.com/zq-zq/p/14674172.html