标签:range mat mic highlight space dom end nbsp his
用python在一个图中显示画两个hist图:
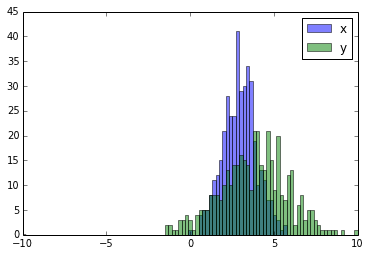
import random
import numpy
from matplotlib import pyplot

x = [random.gauss(3,1) for _ in range(400)]
y = [random.gauss(4,2) for _ in range(400)]

bins = numpy.linspace(-10, 10, 100)

pyplot.hist(x, bins, alpha=0.5, label=‘x‘)
pyplot.hist(y, bins, alpha=0.5, label=‘y‘)
pyplot.legend(loc=‘upper right‘)
pyplot.show()
结果显示:
标签:range mat mic highlight space dom end nbsp his
原文地址:https://www.cnblogs.com/huadongw/p/14854129.html