标签:com class http blog div code img style java size javascript
系统现在很慢”似乎是对系统的性能最常用的抱怨了,但究竟慢到什么程度,如何来界定慢,可能需要对性能进行量化,对于OS来说,大致主要分为cpu,内存,磁盘,网络等组件,对这些维度的性能量化,不但可以更准确的定位到系统的瓶颈,更是做容量评估的基础。下面先看看cpu。
Cpu的性能主要跟缓存,主频,指令集,工艺,流水线等相关因素有关。
当前微处理器的设计上主要分为精简指令集(RISC),复杂指令集(CISC),所以对于不同的cpu来说,如果使用的指令集不同,单纯的从时钟频率来判断频率高的就相应的性能就高,通常并不准确。
Cpu的性能上每18个月就会增长一倍,而内存的速度在七年里才增长一倍,鉴于速度上的不匹配,而产生的L1,L2 cache。下表是不同的存储访问的延时。
Cache location and type    Access time (in ns)    Size    "Good" hit rate
L1 on-chip                     1-3    8-64 KB    >90%
L2 on-chip                     6-18    1-8 MB    >50%
L3 off-chip                    30-40    8-32 MB    >30%
Main memory                    220    Very large    -
对于开发或者运维人员来说,无法离开业务或者系统的负载来谈cpu的量化,拿着指令集来进行性能调优或者容量规划似乎是make no sense。所以对当前cpu的负载能力,这里从三个方面来量化:cpu数量,cpu利用率,load。
1, cpu数量

这里是在测试机上,linux操作系统查看当前cpu的个数:
    物理cpu个数:
[root@xpchild ~]# cat /proc/cpuinfo | grep "physical id" | sort | uniq | wc -l
2
cpu core的个数:
[root@xpchild ~]# cat /proc/cpuinfo | grep "cpu cores" | uniq -c
16 cpu cores       : 4
逻辑cpu的个数:
[root@xpchild ~]#  cat /proc/cpuinfo | grep "siblings" | uniq
siblings        : 8
即这台机器:两颗物理cpu,每颗物理cpu有4个cores。而每颗物理cpu又有8个逻辑cpu,即开启了超线程,每个core 又enable了超线程,所以会看到有16个processor。
2, load
其实load的指标反映的是进程的排队情况,也就是当cpu的处理能力不足的时候,进程会在运行的队列里进行排队,等待cpu时间,当系统的任务过多,cpu处理能力不足的时候,load就会显著的升高。
先了解下进程的状态,如下图:
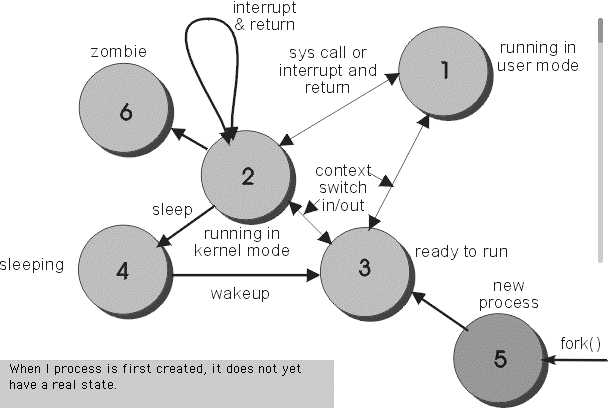
从使用系统调用fork()创建一个进程到进程从进程表中删除,进程会经历多种的状态,在上图显示了六种状态,分表是:
一个进程的生命周期可以描述为:
首先会调用fork()来创建一个进程,然后当exec()的时候,并不是就分配了cpu,因为cpu的分配有多种方式,比如抢占式,时间片轮询等,所以这时进程会进入准备队列,即就绪状态,随时都可以执行。
当进程获得cpu时间的时候,进程会进入状态1(running in user mode),这时也会因为system clock的原因而重新又进入准备队列中。
比如进程要读取操作系统文件的内容,那么将发起一个系统调用read(),进程进入状态2(running in kernel mode),然后cpu将执行os的服务程序,这里执行的其实就是硬盘控制器的驱动程序,执行完成后,进程进入状态4(sleeping)。
驱动程序其实是发送的硬盘控制器的指令,硬盘控制器接受到指令后,开始从硬盘上读取数据,这时进程一直处在sleeping的状态,等数据准备完成之后,硬盘控制器将发送一个中断指令,cpu接受到中断后,进入中断服务处理程序,拷贝数据到内存中,然后进程被唤醒,从新进入就绪状态。
当进程显示的调用exit()时,系统调用将释放进程使用的数据结构,但进程表中的slot还保留着,因为这块区域是exit的代码区域,父进程需要根据它来判断是否正常exit,这时进程进入状态6(zombie),这时进程除了process table里的一些内容外,没有了其它任何东西,所以也没有办法kill这个进程,这个时候只能等待系统来清理。
查看当前系统的load:
[oracle@xpchild /home/oracle]
$ cat /proc/loadavg
1.73 2.10 1.96 3/2569 866
参数的解释是:
avg_1 (1.73) 1-分钟平均负载
lavg_5 (2.10) 5-分钟平均负载
lavg_15(1.96) 15-分钟平均负载
nr_running (3) 在采样时刻,运行队列的任务的数目
nr_threads (2569) 在采样时刻,系统中活跃的任务的个数(不包括运行已经结束的任务)
last_pid(866) 最大的pid值,包括轻量级进程,即线程
如果当前系统有两个cpu,那么每颗cpu的的运行队列长度就是1.73/2=0.86。
对于load的值,如果恰好等于系统的cpu的个数,说明没有排队的现象,cpu的处理能力刚好能够处理当前的任务,如果load除以cpu的个数大于5的话,就说明排队的现象比较严重,cpu就开始成为系统的瓶颈了。
3, cpu利用率的计算
[oracle@xpchild /home/oracle]
$ cat /proc/stat
cpu  1328826685 9908 956723151 37475308887 385172562 1674680 40475782
cpu0 410951159 118 270447961 1807752465 3995607 1256760 17354845
cpu1 87245025 2055 64833801 2348250538 9854553 51903 1531320
cpu2 72781822 257 61529788 2352243761 22342448 9670 2855194
cpu3 46745786 1206 44133270 2248648260 170037161 69330 2128288
cpu4 123440853 1554 31290213 2341183797 13100817 84271 2656769
cpu5 36306470 620 11485132 2460075134 3238150 39536 624727
cpu6 56711524 8 60381304 2390770657 2721730 1 1174918
cpu7 35676024 46 84850159 2356783851 33411961 0 1038483
cpu8 99217709 166 22269812 2386700351 2648336 46 921814
cpu9 35316582 71 9077959 2465760121 1396419 0 218414
cpu10 55429624 5 58736923 2393997677 2403804 0 1190020
cpu11 36376053 127 91350249 2353554118 29403857 2 1075565
cpu12 94113797 2498 20676353 2381646886 13099910 86996 2131685
cpu13 35960873 644 11974688 2451183596 11241526 31587 1376153
cpu14 64988644 65 47646699 2371237606 24944343 15514 2924129
cpu15 37564733 461 66038834 2365520062 41331934 29056 1273450
intr 32192598678 3652207391 10 0 6 6 0 0 0 0 150 0 0 65 0 0 0 0 0 0 0 0 0 0 0 0 0 0 0 0 0 0 0 0 0 0 0 0 0 0 0 0 0 0 0 0 0 0 0 0 0 41 0 0 0 0 0 0 0 0 0 0 0 0 0 0 0 1169002395 0 0 0 0 0 0 0 0 0 0 0 0 0 0 0 0 0 0 0 0 0 0 0 0 0 0 0 0 0 0 0 0 0 0 0 0 0 0 0 961594445 0 0 0 0 0 0 0 3774974 0 0 0 0 0 0 0 0 0 0 0 0 0 0 0 0 0 0 0 0 0 0 0 0 0 0 0 0 0 0 0 0 0 0 0 0 0 0 0 0 0 0 0 0 0 0 0 0 0 0 0 0 0 0 0 0 0 0 0 0 0 0 0 0 0 0 0 0 0 0 0 0 0 0 0 0 0 0 0 0 0 0 0 0 0 0 0 0 0 0 0 0 0 0 3762233747 0 0 0 0 0 0 0 1168948909 0 0 0 0 0 0 0 0 0 0 0 0 0 0 0 60 0 0 0 0 0
ctxt 74186330107
btime 1286108830
processes 76903816
procs_running 4
procs_blocked 0
user (1328826685) 从系统启动开始累计到当前时刻,用户态的CPU时间(单位:jiffies) ,不包含
nice值为负进程。1jiffies=0.01秒
nice (9908)
从系统启动开始累计到当前时刻,nice值为负的进程所占用的CPU时间(单位:jiffies)
system (956723151)
从系统启动开始累计到当前时刻,核心时间(单位:jiffies)
idle (37475308887)
从系统启动开始累计到当前时刻,除硬盘IO等待时间以外其它等待时间(单位:jiffies)
iowait (385172562)
从系统启动开始累计到当前时刻,硬盘IO等待时间(单位:jiffies) ,
irq (1674680)
从系统启动开始累计到当前时刻,硬中断时间(单位:jiffies)
softirq (40475782)
从系统启动开始累计到当前时刻,软中断时间(单位:jiffies)
CPU时间=user+system+nice+idle+iowait+irq+softirq
“intr”这行给出中断的信息,第一个为自系统启动以来,发生的所有的中断的次数;然后每个数对应一个特定的中断自系统启动以来所发生的次数。
“ctxt”给出了自系统启动以来CPU发生的上下文交换的次数。
“btime”给出了从系统启动到现在为止的时间,单位为秒。
“processes
(total_forks) 自系统启动以来所创建的任务的个数目。
“procs_running”:当前运行队列的任务的数目。
“procs_blocked”:当前被阻塞的任务的数目。
Cpu利用率的计算方法:
这是一段perl脚本的计算cpu利用率的代码
$cpuline = `cat /proc/stat |grep -w cpu| head -1`;
 chomp($cpuline);
 @cpu_arr = split /\s+/,$cpuline;
 $cpu_total=$cpu_arr[1]+$cpu_arr[2]+$cpu_arr[3]+$cpu_arr[4]+$cpu_arr[5]+$cpu_arr[6]+$cpu_arr[7];
 if(! defined $cpu_pre_total){
        $cpu_usr=0;
        $cpu_sys=0;
        $cpu_id=0;
        $cpu_io=0;
 }

 else{
        $cpu_usr = int(($cpu_arr[1]+$cpu_arr[2]-$cpu_pre_usr)*100/($cpu_total - $cpu_pre_total));
        $cpu_sys = int(($cpu_arr[3]+$cpu_arr[6]+$cpu_arr[7]-$cpu_pre_sys)*100/($cpu_total - $cpu_pre_total));
        $cpu_io  = int(($cpu_arr[5]-$cpu_pre_io)*100/($cpu_total - $cpu_pre_total));
        $cpu_id  = int(($cpu_arr[4]-$cpu_pre_id)*100/($cpu_total - $cpu_pre_total));
 }
 $cpu_pre_usr = $cpu_arr[1]+$cpu_arr[2];
 $cpu_pre_sys = $cpu_arr[3]+$cpu_arr[6]+$cpu_arr[7];
 $cpu_pre_io  = $cpu_arr[5];
 $cpu_pre_id  = $cpu_arr[4];
 $cpu_pre_total = $cpu_arr[1]+$cpu_arr[2]+$cpu_arr[3]+$cpu_arr[4]+$cpu_arr[5]+$cpu_arr[6]+$cpu_arr[7];

User的cpu利用率=(user+nice)/total
System的cpu利用率=(system+irq+ softirq)/total
Idle的cpu利用率=(idle)/total
Io的cpu利用率=(io wait)/total
所以,在对cpu进行性能量化的时候,可以根据这几个方面进行评估,cpu的特性,cpu的数量,当前系统的压力(主要关注load,cpu利用率这两个指标)。
标签:com class http blog div code img style java size javascript
原文地址:http://www.cnblogs.com/xpchild/p/3695007.html